Statistical Analysis on USA Youtube Trending Videos

13 August 2023

Project
mini profile picture

by Muhammad Reyhan Arighy Data Scientist

banner

Problem Statements

The background of the problem is very important to know because it will make it easier to identify the source of the problem and determine the right solution. Background information on the problem can be used as a basis for evaluating data and making wise decisions in dealing with the problem at hand. In this context it includes:

  1. Do trending videos have the same quality and characteristics even though the video attributes vary?
  2. Why can increased user accessibility help manage trending videos?
  3. How can screening process help determine the suitability of uploaded content so that views and engagement increase?
  4. What features can help improve the relationship between creators and content connoisseurs so that new content will be positively received?
  5. How and how much is the relationship between various attributes in determining the sustainability of trending videos?

The hypothesis being tested is the anti-thesis of the problem background. Everything about the data has no significant intercorrelation and even if there is it is just coincidence.

Data Understanding

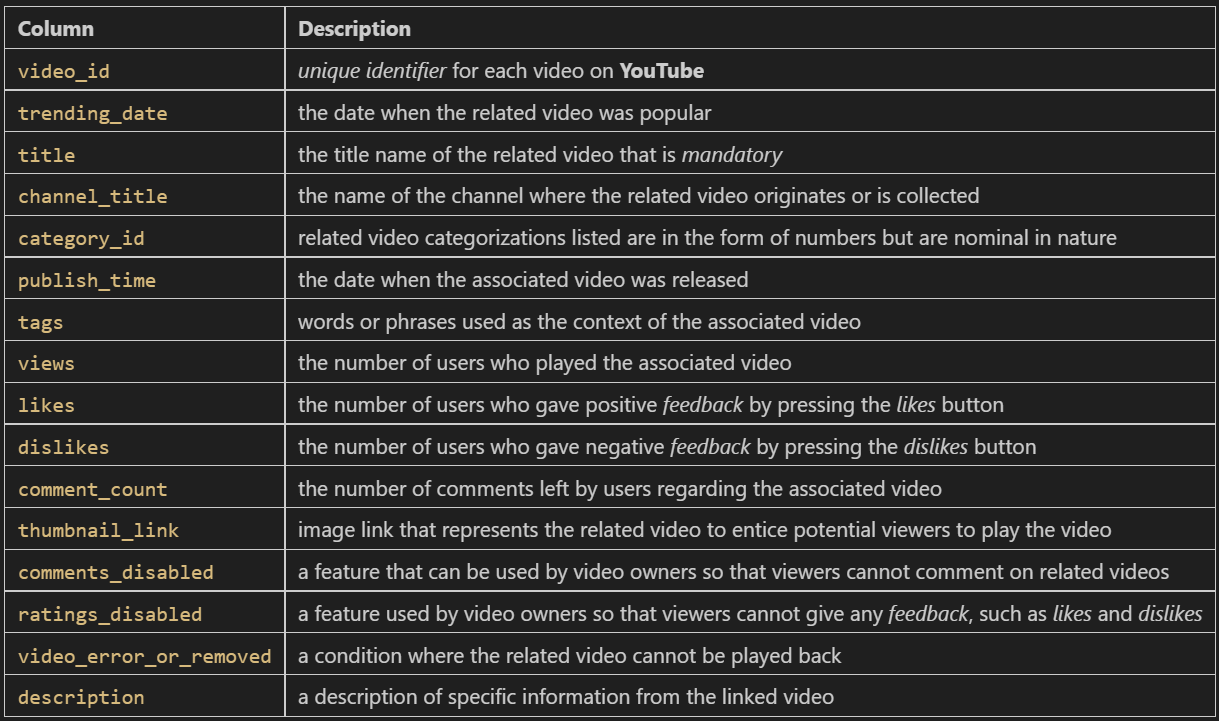
This dataset is provided as material for working on the topic of Trending Video Statistics on YouTube specifically for the United States region. In the early stages, the information contained will be described in more depth to understand its characteristics. As material for analysis, the datasets used are sourced from following link, for each row the data contained consists of 16 columns, each of which contains information as follows:

dataset-info

The dataset will go through some kind of data cleansing and feature engineering processes in order to make it well-prepared before taking into account of Exploratory Data Analysis.

Explanatory Data Analysis
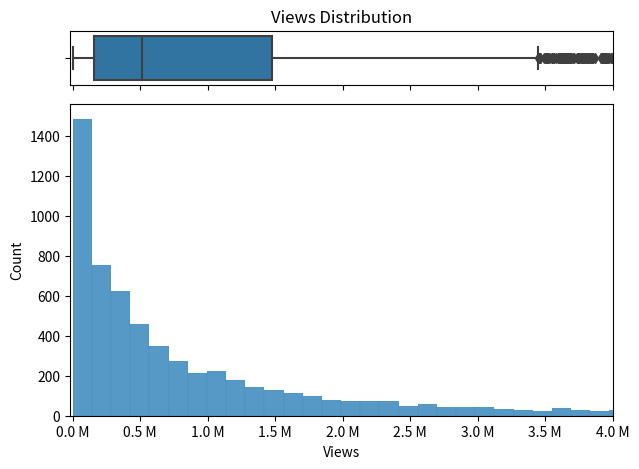
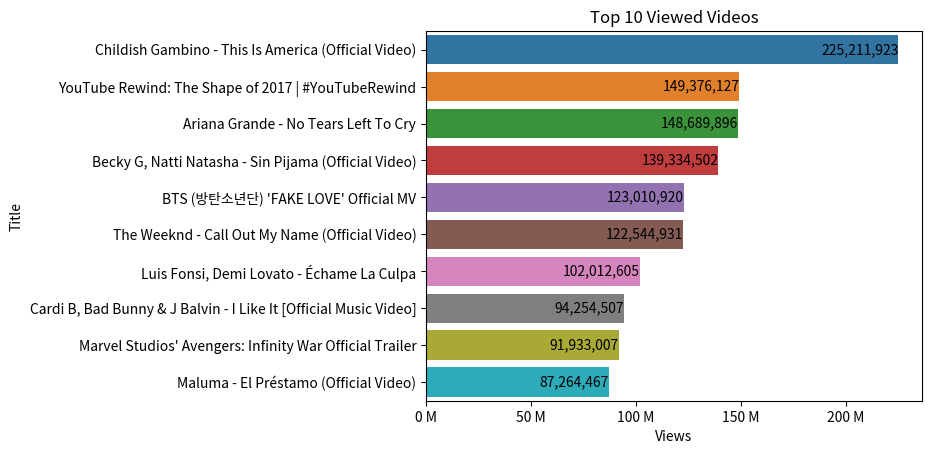
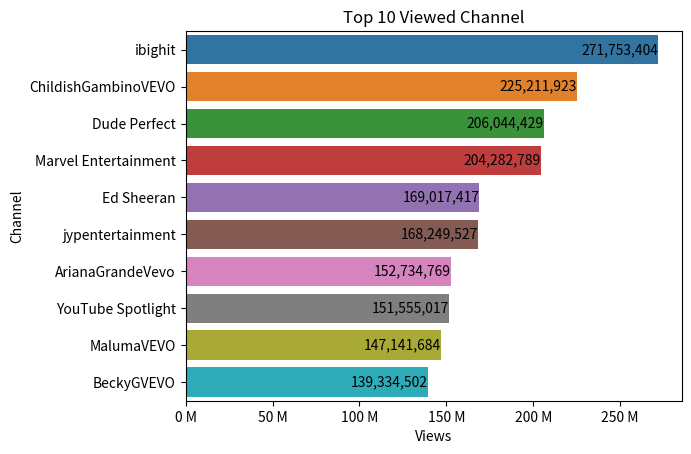
Views Research

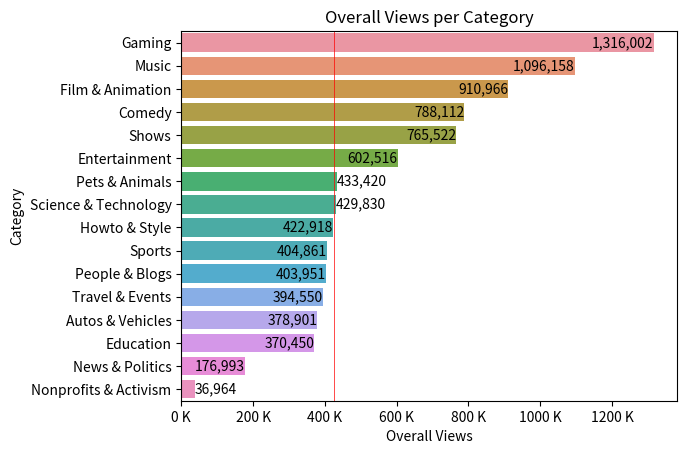
The analysis in this section is to identify impression metrics based on data in the views column. Here it will be examined whether there is a significant difference between the average number of views in each video category.

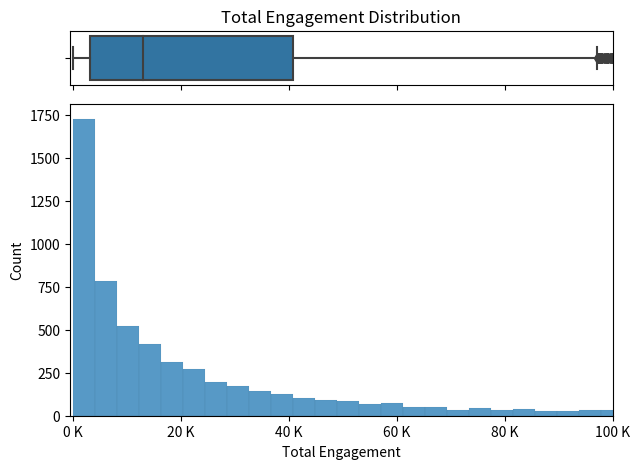
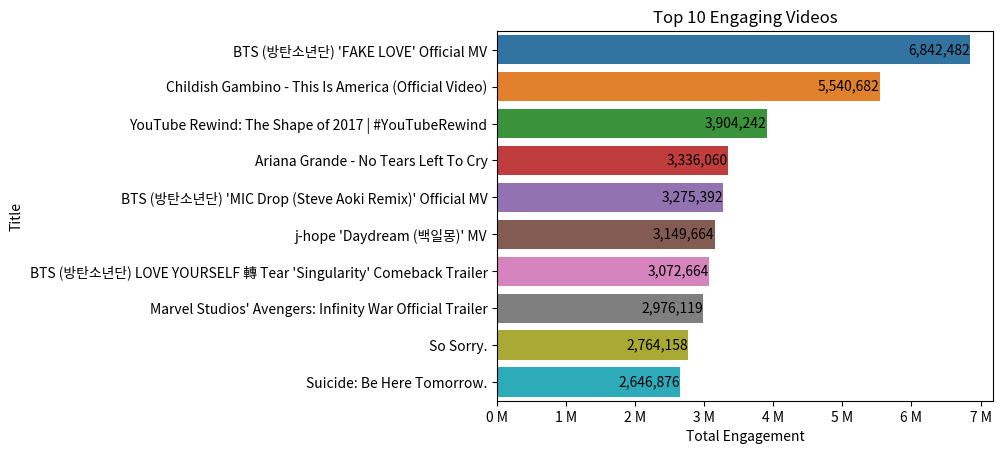
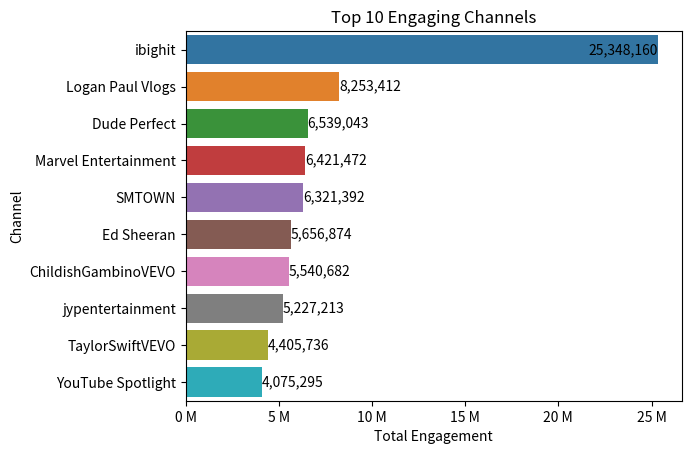
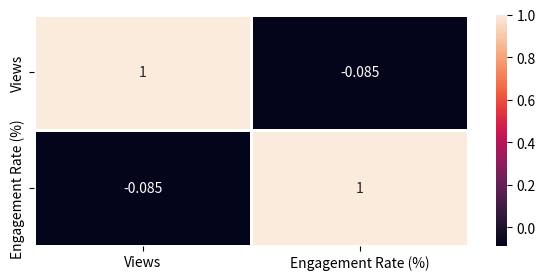
Engagement Importance

Engagement is a term used to describe the interaction between viewers and uploaded content. It includes various things such as the number of likes, dislikes, and comments. Here the data will be filtered based on the feature availability status in ratings and comments.
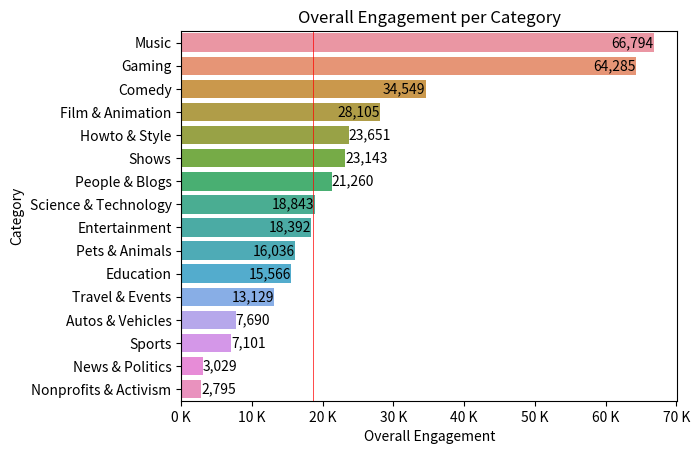
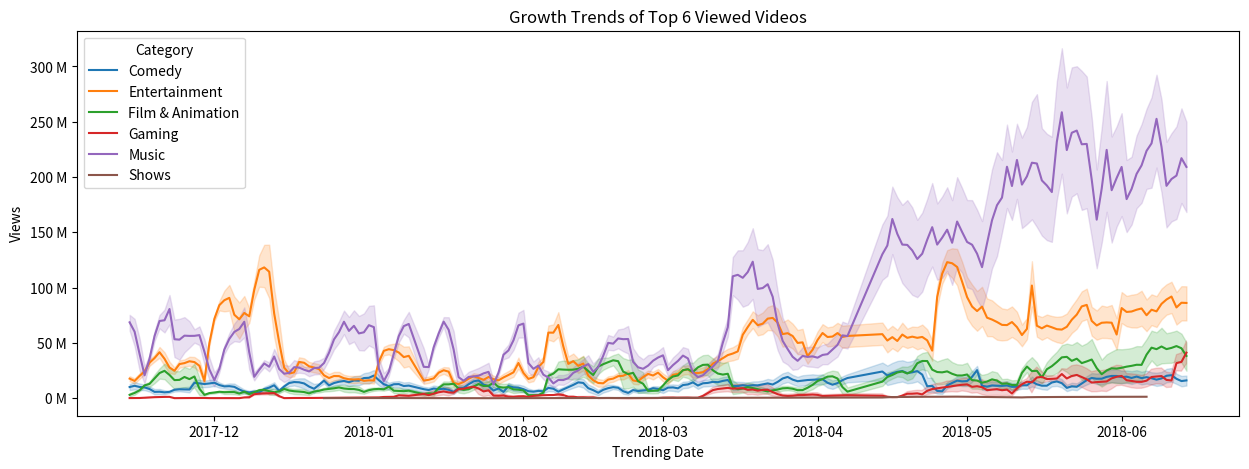
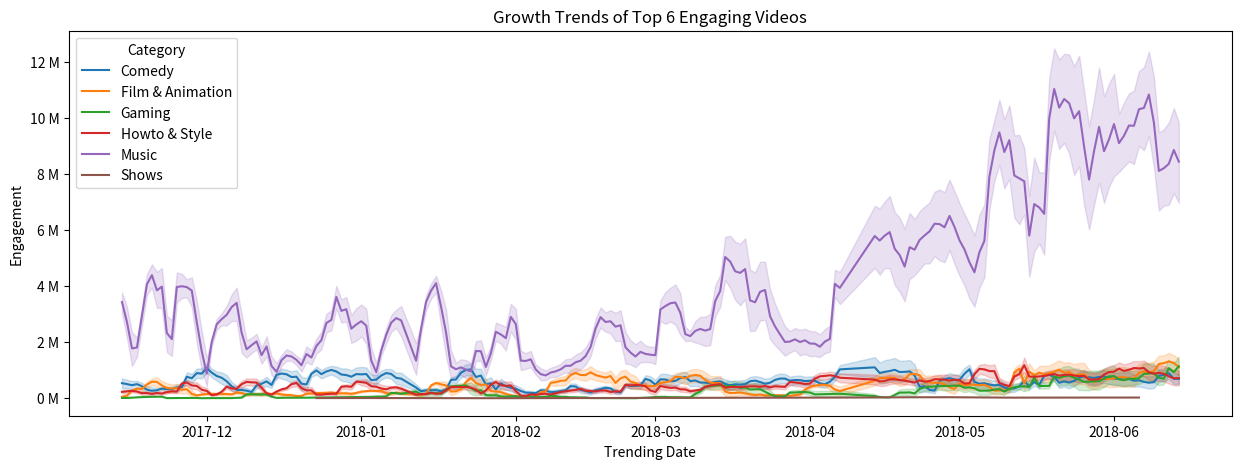
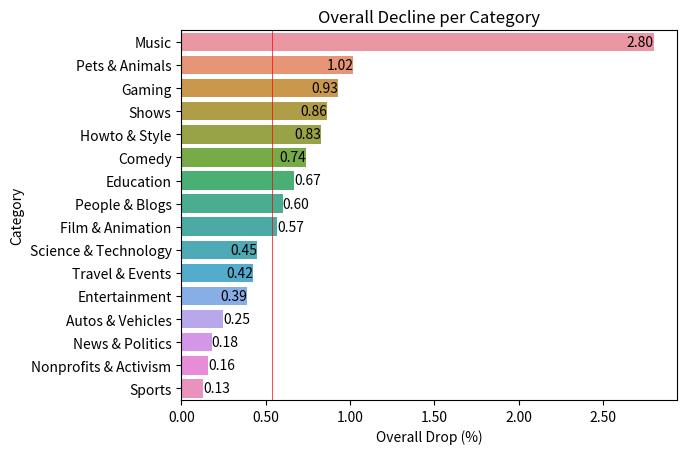
Growth Analysis

Growth Analysis is a process of measuring and evaluating the growth of an aspect. This analysis can provide valuable information to improve YouTube service performance and predict future growth. By knowing the growth trends in each category, YouTube can determine a priority scale to make recommendations regarding which industries are currently popular.

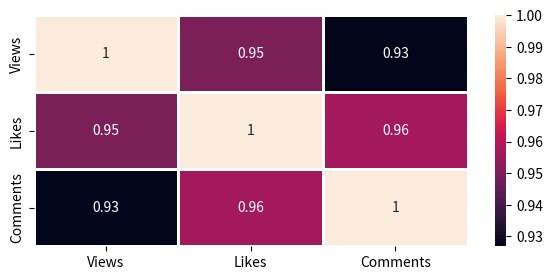
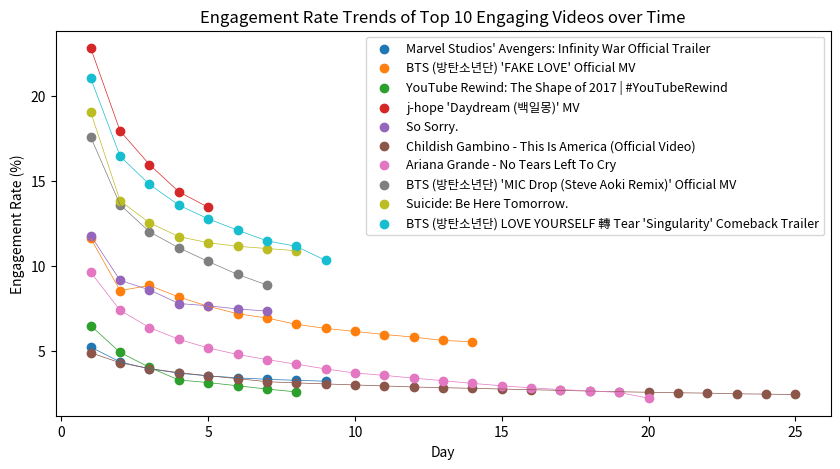
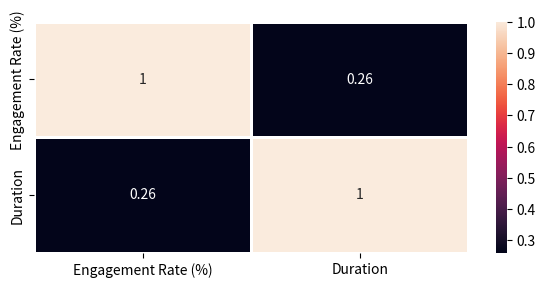
Engagement Rate Trends

After understanding the significant relationship between the number of views and engagement. We will try to analyze turnover from each increase in views to the number of engagements in terms of engagement rate.

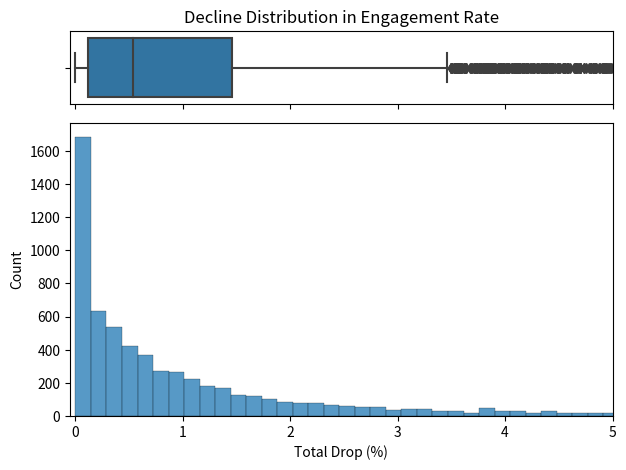
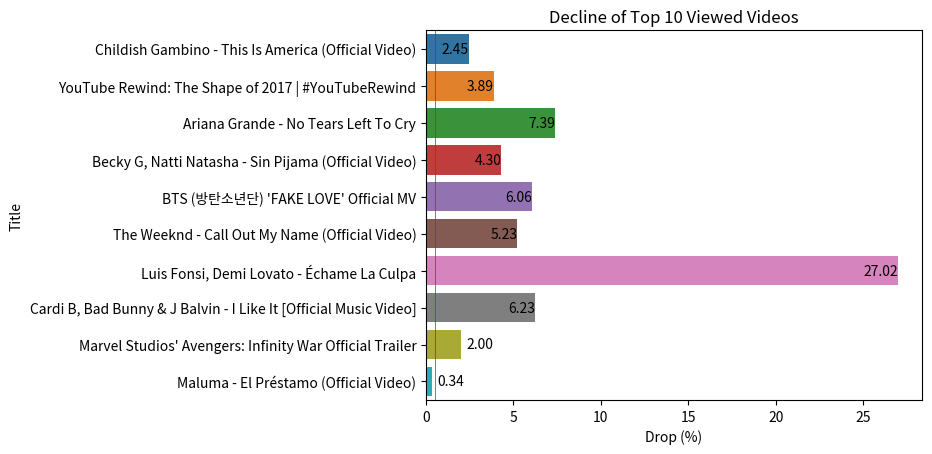
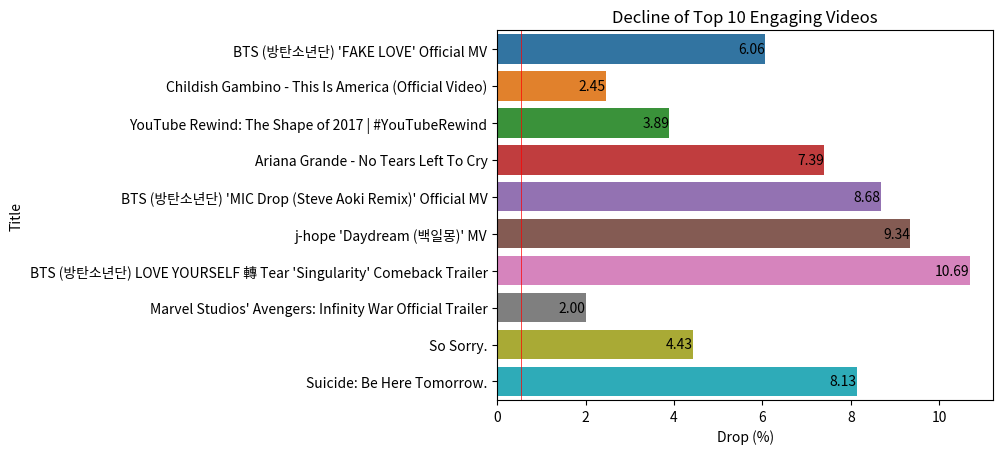
Decline in Engagement Rate

That way, we will discuss this phenomenon in depth according That way, we will discuss this phenomenon in depth according
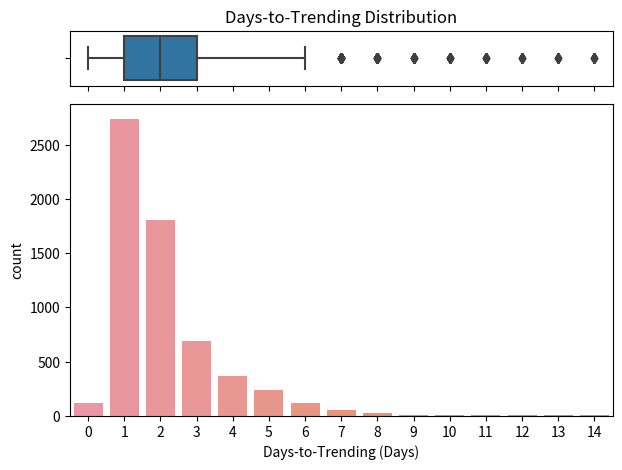
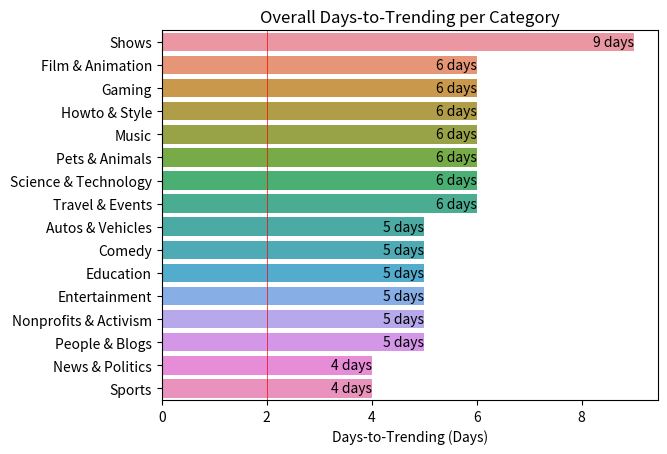
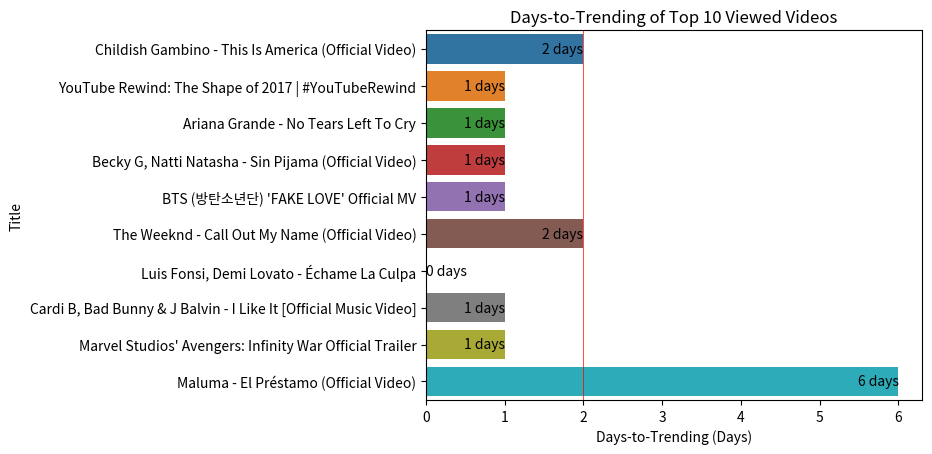
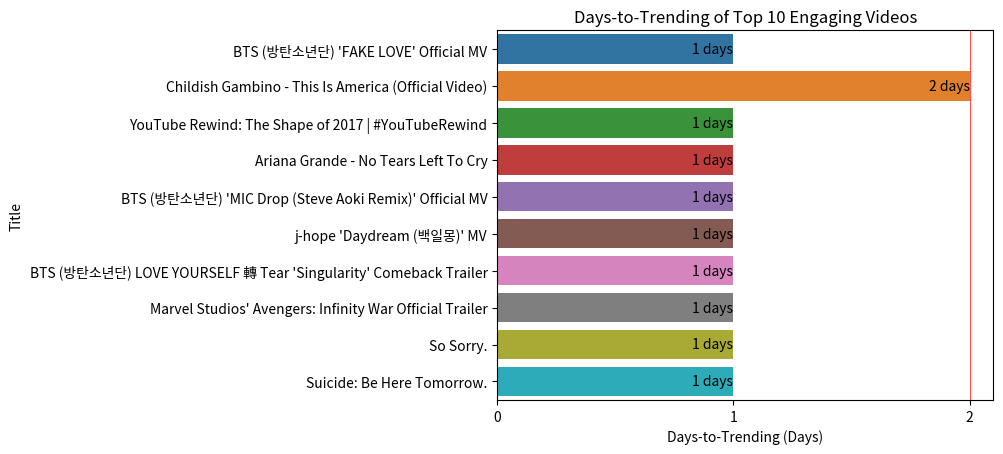
Days-to-Trending

Days-to-trending is a metric used to measure the time it takes for a video to enter the trending list on YouTube. The calculation is done by calculating the difference between the date the video was uploaded and the date the video was first trending.
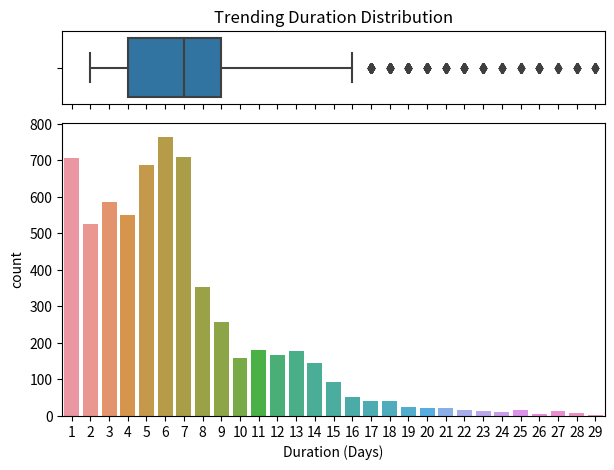
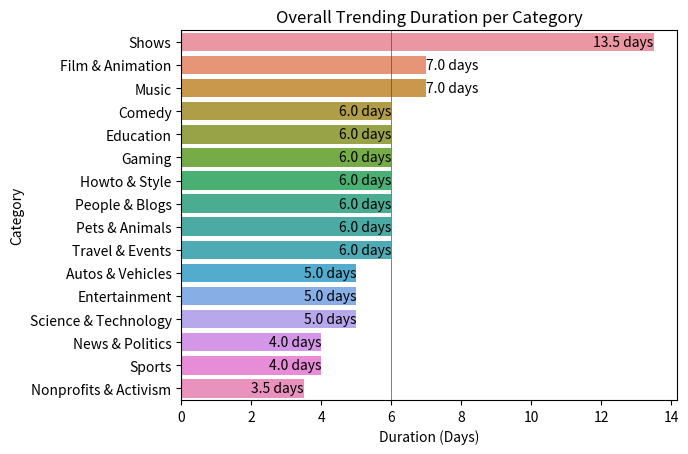
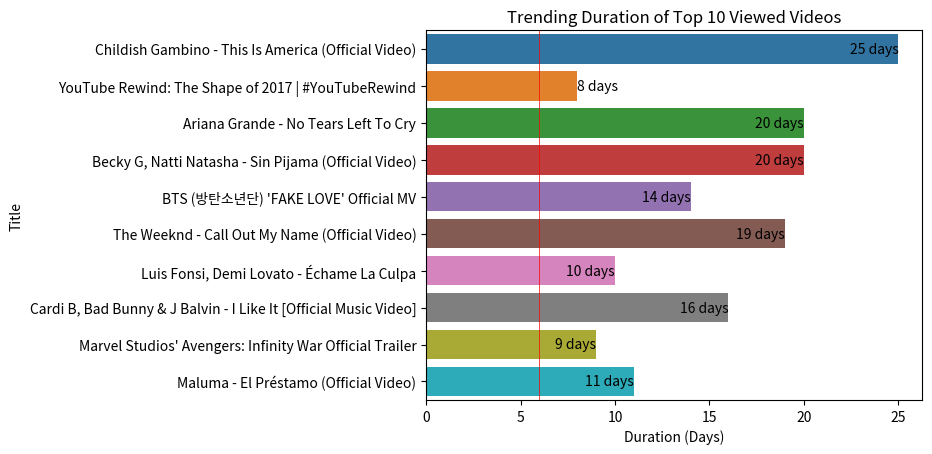
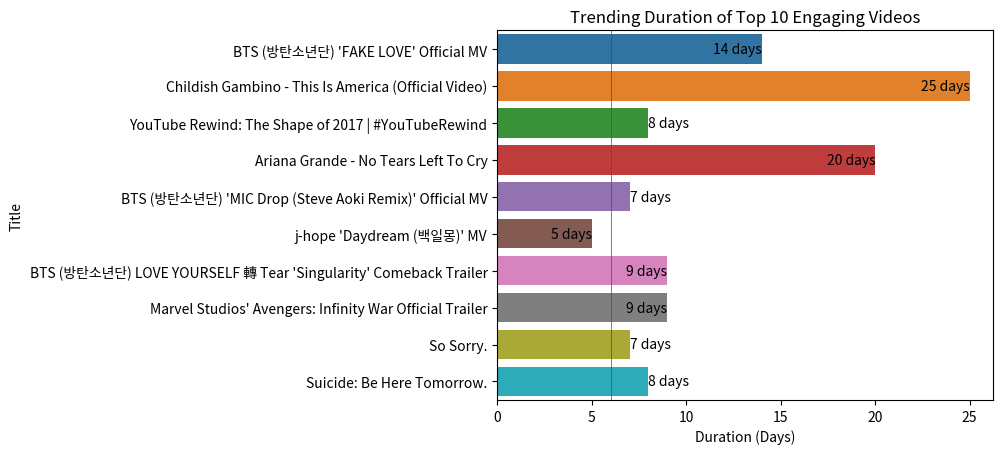
Trending Duration

Trending on YouTube refers to videos or content that are currently popular at a particular moment. Trending is calculated based on a number of factors, including the number of views, level of engagement, and speed of growth of views. YouTube has a special section for content that is trending, which users can see when opening the main page or doing a search on the platform.
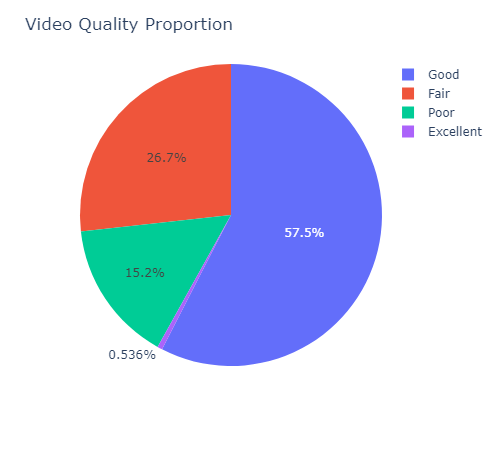
Video Quality

The quality of a video in this discussion is based on engagement rate which develops every time it is trending. The quality of a video can change depending on how big the effect of decline is received. Therefore, the categorization will be made with the following provisions:
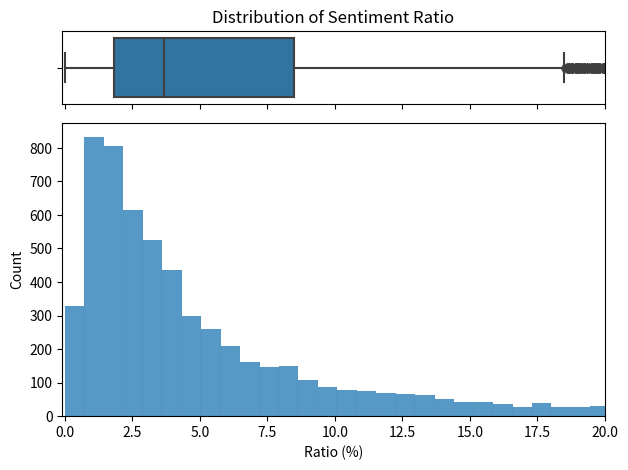
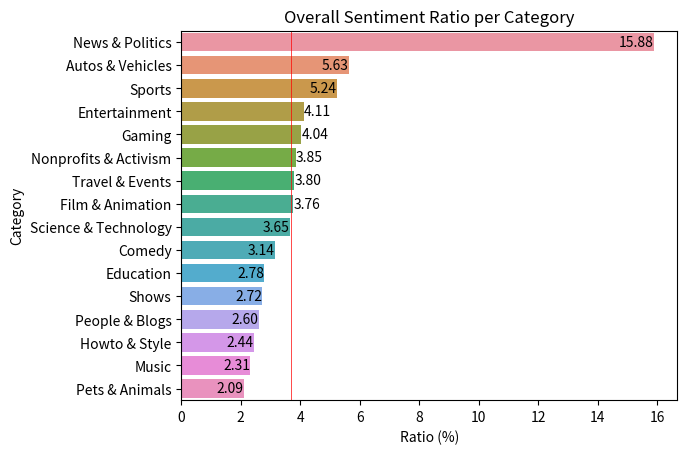
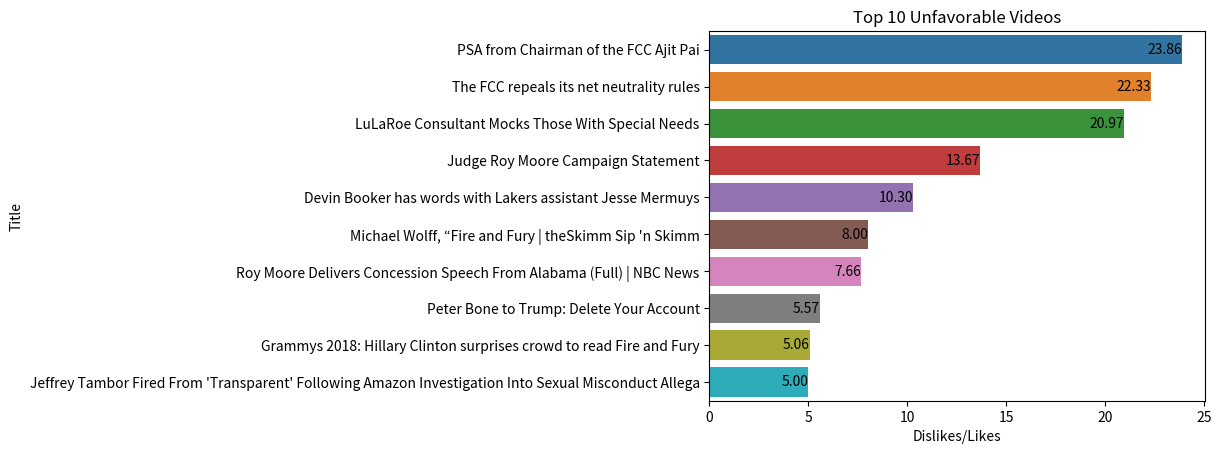
  1. If it is more than equal to 15%, then the quality is Excellent.
  2. If between 3% and 15%, then the quality is Good.
  3. If it is between 1% and 3%, then the quality is Fair.
  4. If it is below 1%, then the quality is Poor.

Sentiment Ratio

Sentiment ratio refers to the ratio of positive and negative sentiments expressed in a video. This ratio is calculated by dividing the number of negative sentiments by the positive sentiments expressed. Sentiment ratio can assist in evaluating audience response and can be used to measure the popularity or success of a product, brand, or campaign embedded in a circulating video.
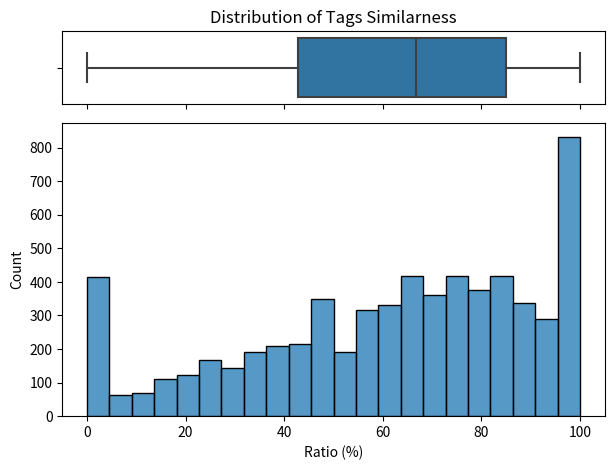
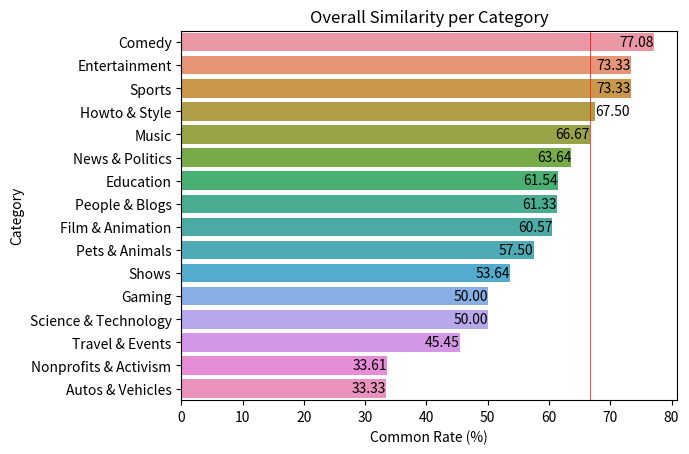
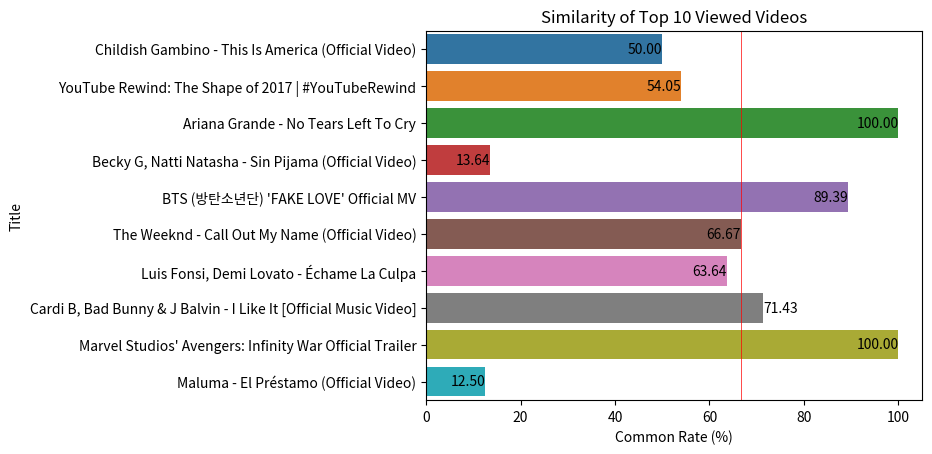
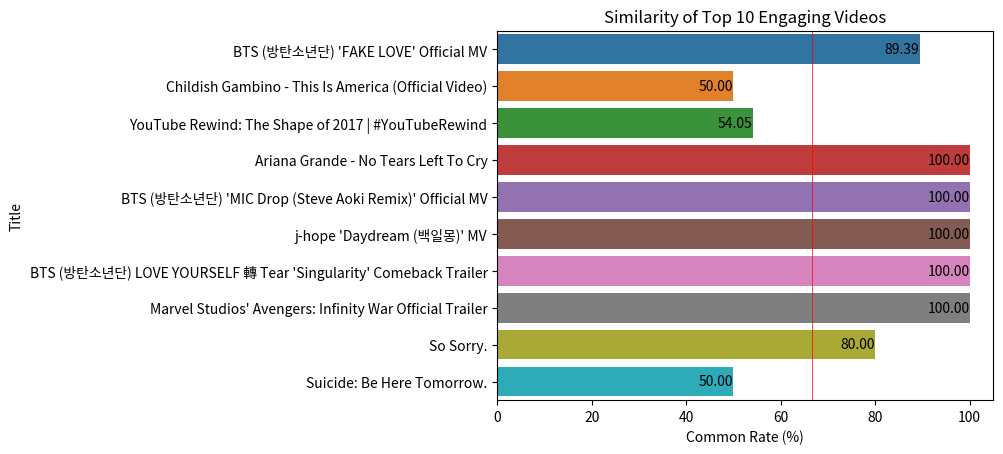
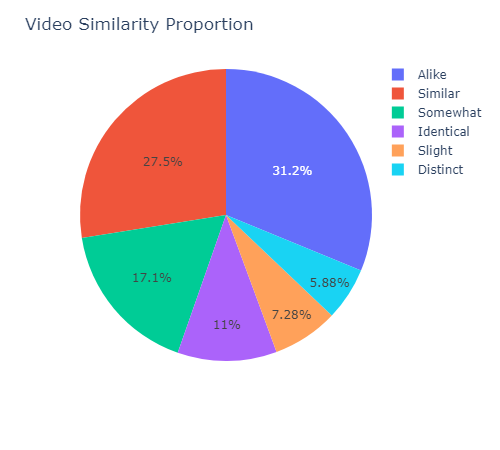
Similarity Degree

Similarity degree is a measure to measure the extent to which two or more objects have the same context in terms of certain characteristics, features or characteristics. This calculation is obtained from a comparison of the number of common tags of the total tags used by a video.

Recommendations

It is necessary to evaluate all insights that have been generated in the Exloratory Data Analysis section, which are as follows:

  1. Information about the target audience can provide insight into who is the target audience based on preferences and search history. Preferences can be seen from the audience's track record of responding in the form of likes and comments on videos. This can be used as a determining factor by the YouTube algorithm regarding which videos with similar categories to recommend so that cost effectiveness can be minimized starting from the time side and the capacity of the trending list that can be loaded at a certain time. On the other hand, the campaign or advertising algorithm functionality of a brand can be maximized to suit the video context and behavioural instinct of each user with the aim of minimizing the level of disruption which is quite significant to the possibility of ignorance occurrence.
  2. Video performance can be measured from engagement rate which is growing all the time. A video that does not meet the trending criteria or reaches a saturation point can be removed from the trending page in order to maximize the accessibility of users who are limited by time and the many choices of trending videos that must be enjoyed. Priority recommendations on channels with fairly good performance can be used as a reference by YouTube algorithm in determining what content can be loaded on a trending page at a time. This is based on the amount of engagement that can be achieved from loyal users so they can decide whether a video that is trending can attract the interest of new potential viewers or not.
  3. Validation Approval System which can screen new uploaded content to determine the suitability of the attributes used. For example, videos in certain categories must have qualified requirements to be included in that category. If not, it will potentially create a discrepancy between the video and the audience who enjoys it. This can lead to a fairly low engagement rate and have implications for wasted user time without any positive benefits being received in return.
  4. Assist content creators with certain features such as guidelines, statistical analysis, video quality improvement and attribute recommendations on hashtags when in the process of compiling new content so that it can be received positively by service users.
  5. Providing facilities that can enhance the relationship between content creators and viewers, such as, but not limited to live streaming services, premiere access, discussion forums, and interactive features in the comment section. The goal is to create sustainability viewers who will potentially continue to provide support to content creators to continue to produce quality new content and provide positive benefits to platform users.
  6. Better user experience so as to maximize the main factors that can increase engagement rate, such as easy user accessibility, video performance analysis, monetization, as well as technical and community support.

intentionally left blank

Please find codes detailed on Github channel.

Github

Read next

Traveloka Project

Traveloka Indonesia New Year Hotel Rooms

This project is dedicated to conducting a comprehensive analysis and comparison of various aspects related to hotel accommodations offered during the New Year holiday season in Indonesia, with a primary objective of providing invaluable insights into the practices and improvements within the hospitality industry. In an increasingly competitive market, the project seeks to contribute to the elevation of customer satisfaction, highlighting trends, strengths, and areas for enhancement.

Olist Project

Customer Analysis on Olist E-Commerce

Olist have collected separated information data throughout the year. With current dataset, it is hard to identify customer behaviour. However, the existing dataset poses a challenge in comprehending customer behavior as it lacks a delineation of customer segments. The aspiration of this project lies in empowering Olist to discern and classify their customers into meaningful segments. This segmentation process will enable Olist to gain invaluable insights, refine their marketing strategies, and provide personalized experiences, ultimately fostering enhanced customer satisfaction and optimizing their business operations.

All Projects

Starting a new chapter in my career and believe I'm the right candidate?

Let's Talk