Customer Analysis on Olist E-Commerce

by Muhammad Reyhan Arighy Data Scientist

Mario Billy Gunawan LinkedIn

Muhamad Rafif Bagaskoro LinkedIn
Business Understanding
Introduction
Olist, a Brazilian e-commerce marketplace integrator referred to their website, is an online e-commerce platform designed to facilitate direct sales on e-commerce sites of Brazil. The company's platform connects entrepreneurs with major online retailers and allows shopkeepers to advertise and sell in the marketplaces without complication, enabling retail companies to reach out to the international marketplaces, improve the shopping experience and modify their purchasing behavior.
Olist connects small businesses from all over Brazil to channels without hassle and with a single contract. Those merchants are able to sell their products through the Olist Store and ship them directly to the customers using Olist logistics partners. After a customer purchases the product from, a seller gets notified to fulfill that order. Once the customer receives the product, or the estimated delivery date is due, the customer gets a satisfaction survey by email where he can give a note for the purchase experience and write down some comments.
Context
The dataset has information of 100k orders from 2016 to 2018 made at multiple marketplaces in Brazil. Its features allows viewing an order from multiple dimensions: from order status, price, payment and freight performance to customer location, product attributes and finally reviews written by customers.
Problem Statements
Olist have collected data throughout the year, the data contains seperated information, there are aggregated data, unique data or even combination of both. With olist current dataset, it is hard to identify customer behaviour since it has no representation of customer segments. Moreover, even after understanding the segmentation, what kind of approach should they take?
Hence, the questions to be answered in this project:
Objective
With this project, it is hoped that Olist will be able to classify their customers with the appropriate segmentation.
Project Limitation
The machine learning model built is limited to orders from 2016 to 2018. Thus, the performance of the model will be much different when used to classify customers from today. In addition, this model is built from several selected features based on features importance and correlation analysis to the target.
Analytical Approach
Underlying the problem statements, our main focus lies around the implementation of CRM Campaign, the analytical approach we use are:
Data Understanding
Data Scheme
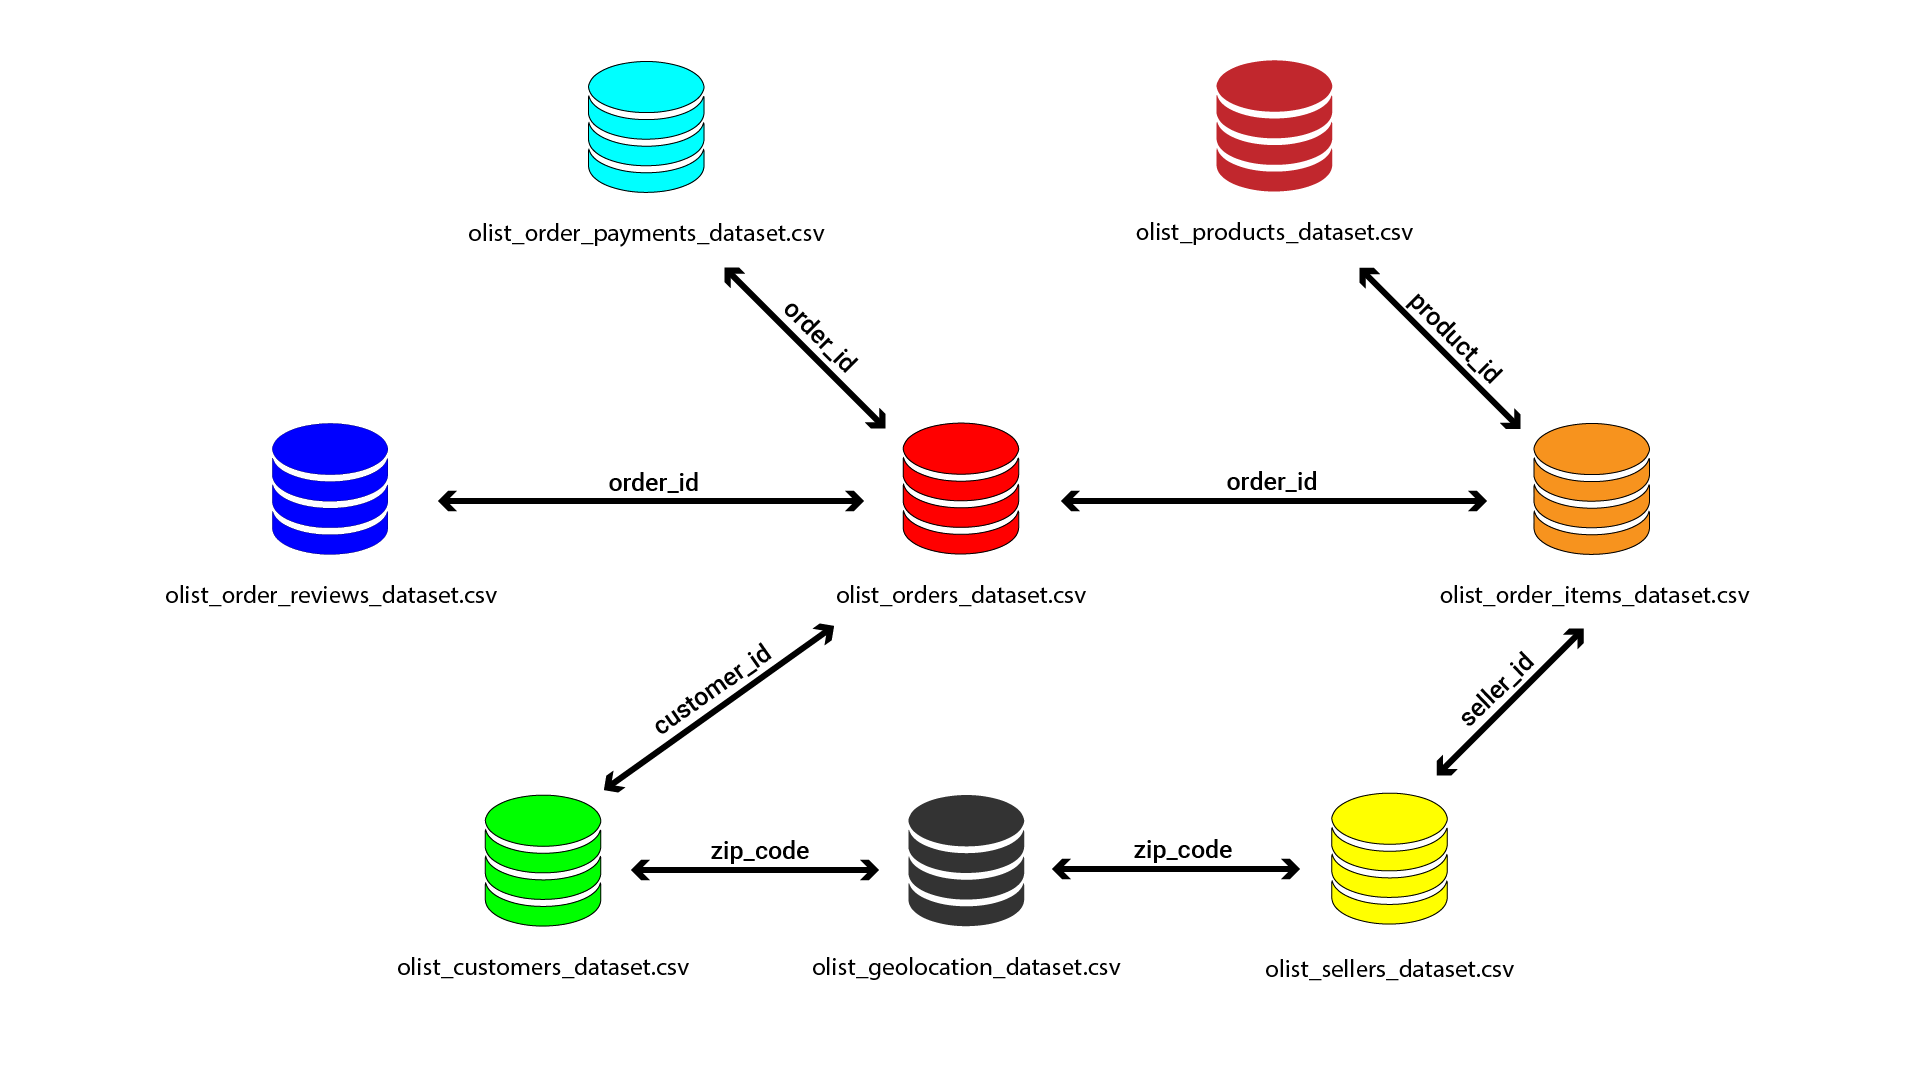
There are nine sets of data provided at the expense of Olist E-Commerce which are freely accessible for the research purposes. Please directly go through this link for data sets information. As merging process based-on data schemes shown above, we inherited three data sets named as Order History, Customer Payments, and Recency-Frequency-Monetary Table.
Explanatory Data Analysis
Evolution of Total Orders in Olist
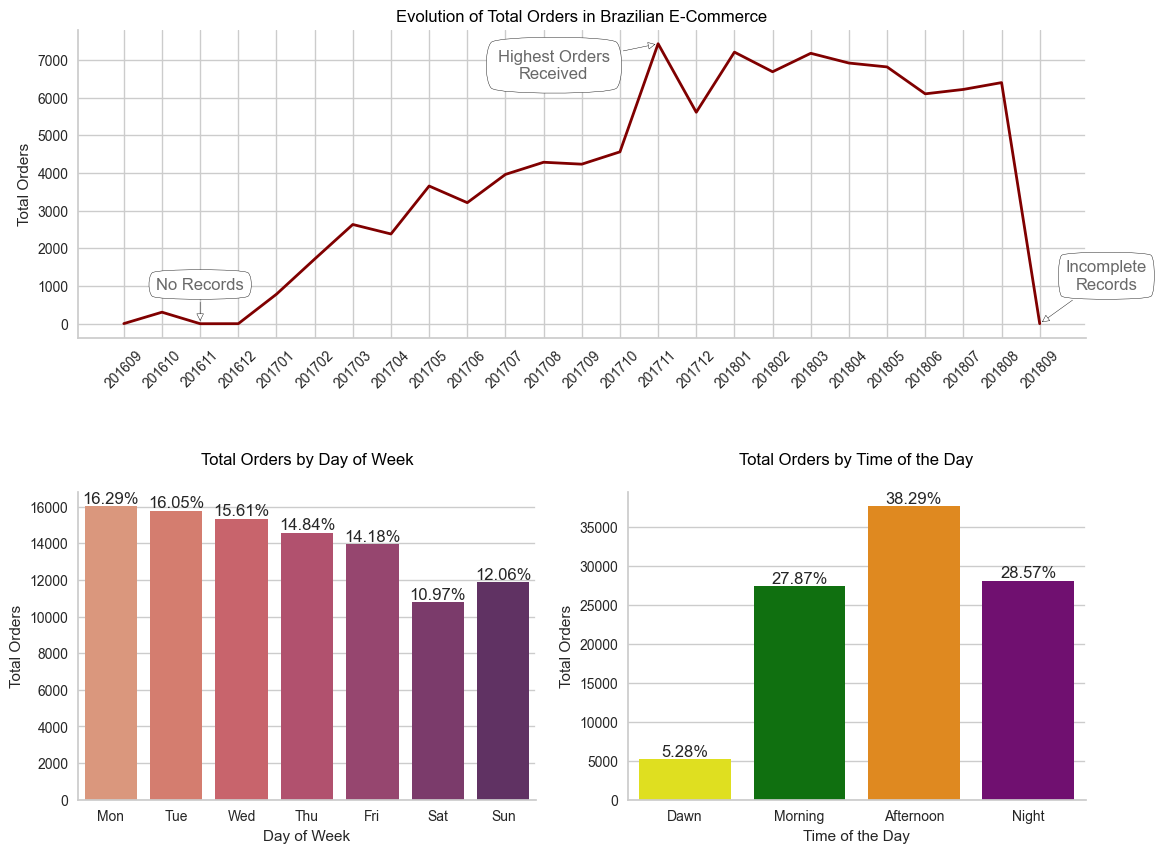
Insight:
Total Orders Comparison Between 2017 and 2018 (Q1-Q3)
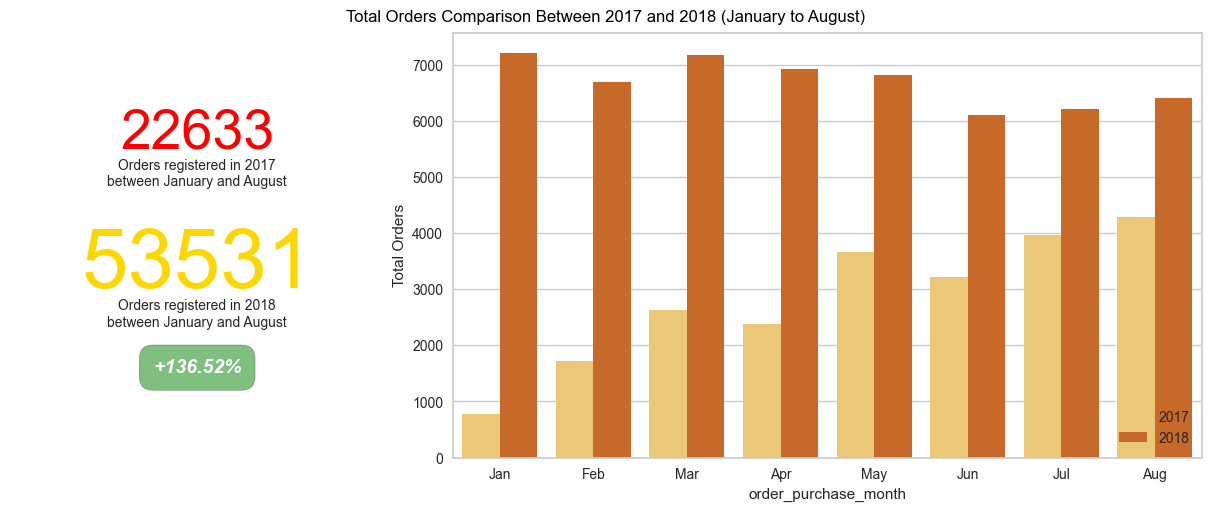
Insight:
Evolution of Olist Orders on Brazilian Regions
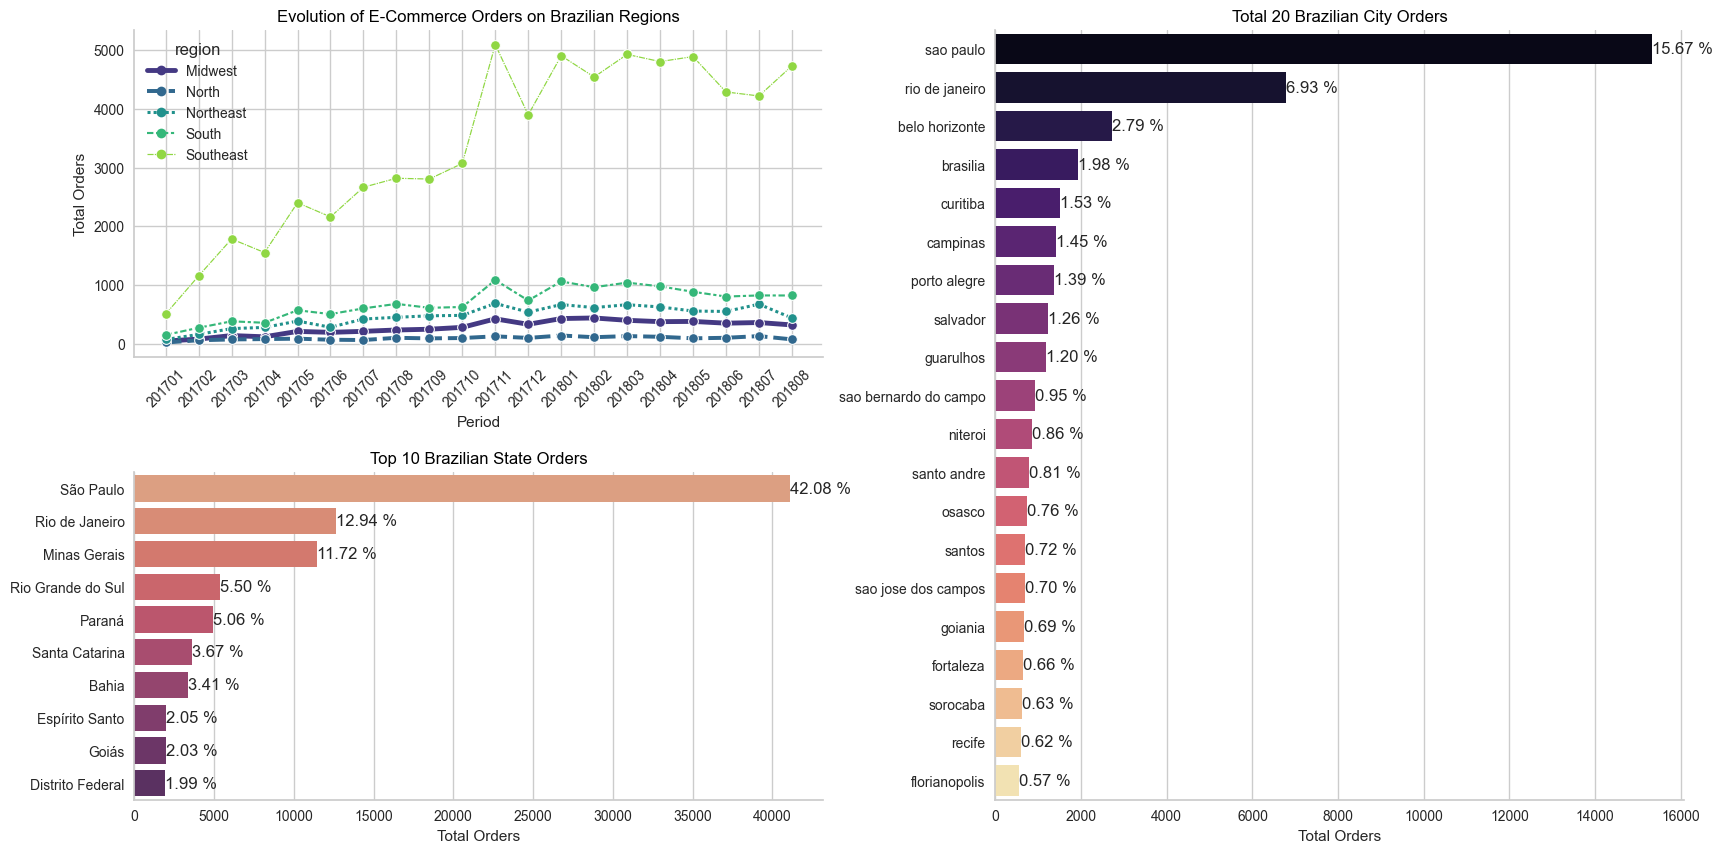
Insight:
Evolution of Olist: Total Orders and Total Amount Sold in R$
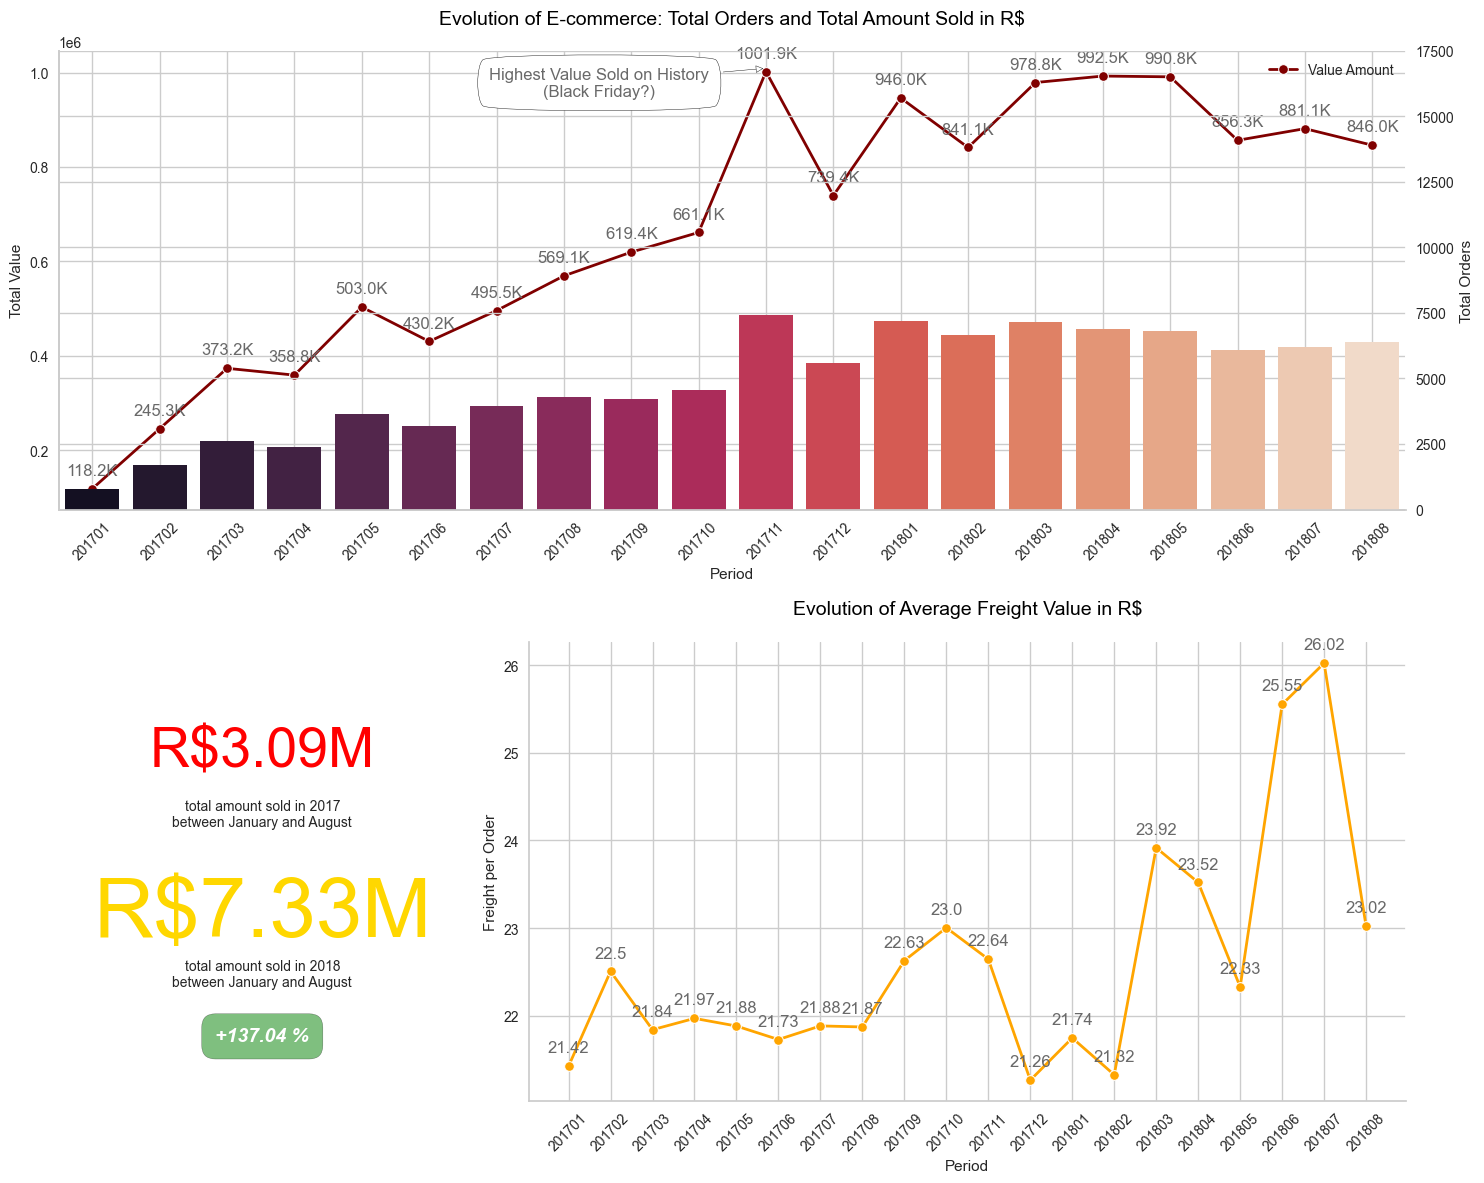
Insight:
Comparative Study: Olist Delivery Performance
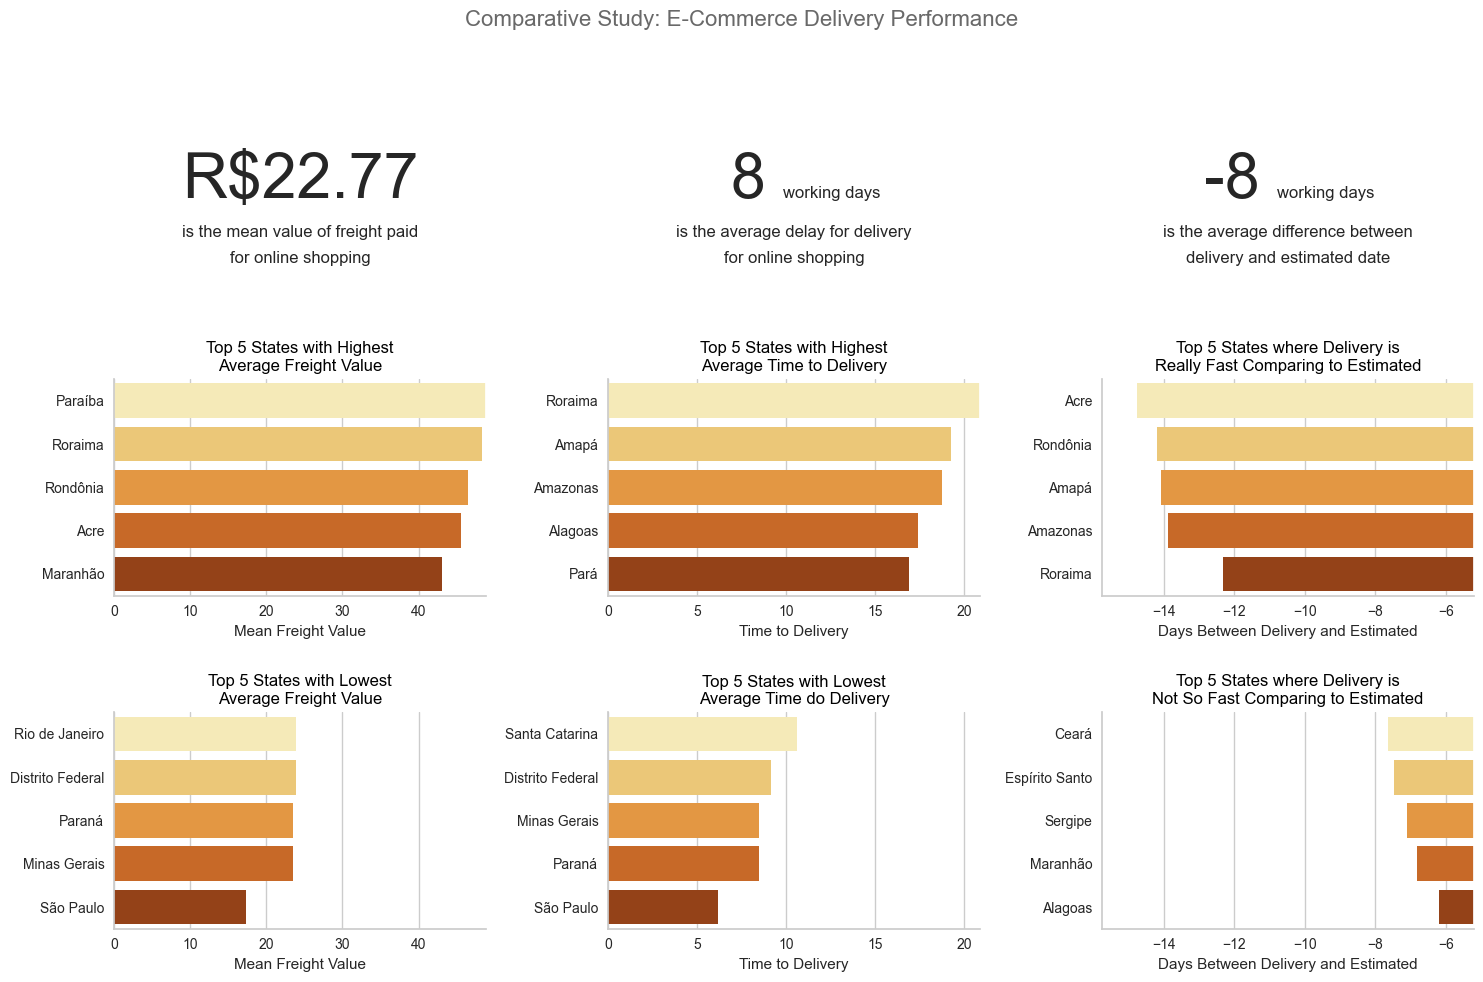
Insight:
Evolution of Payment Types in Olist
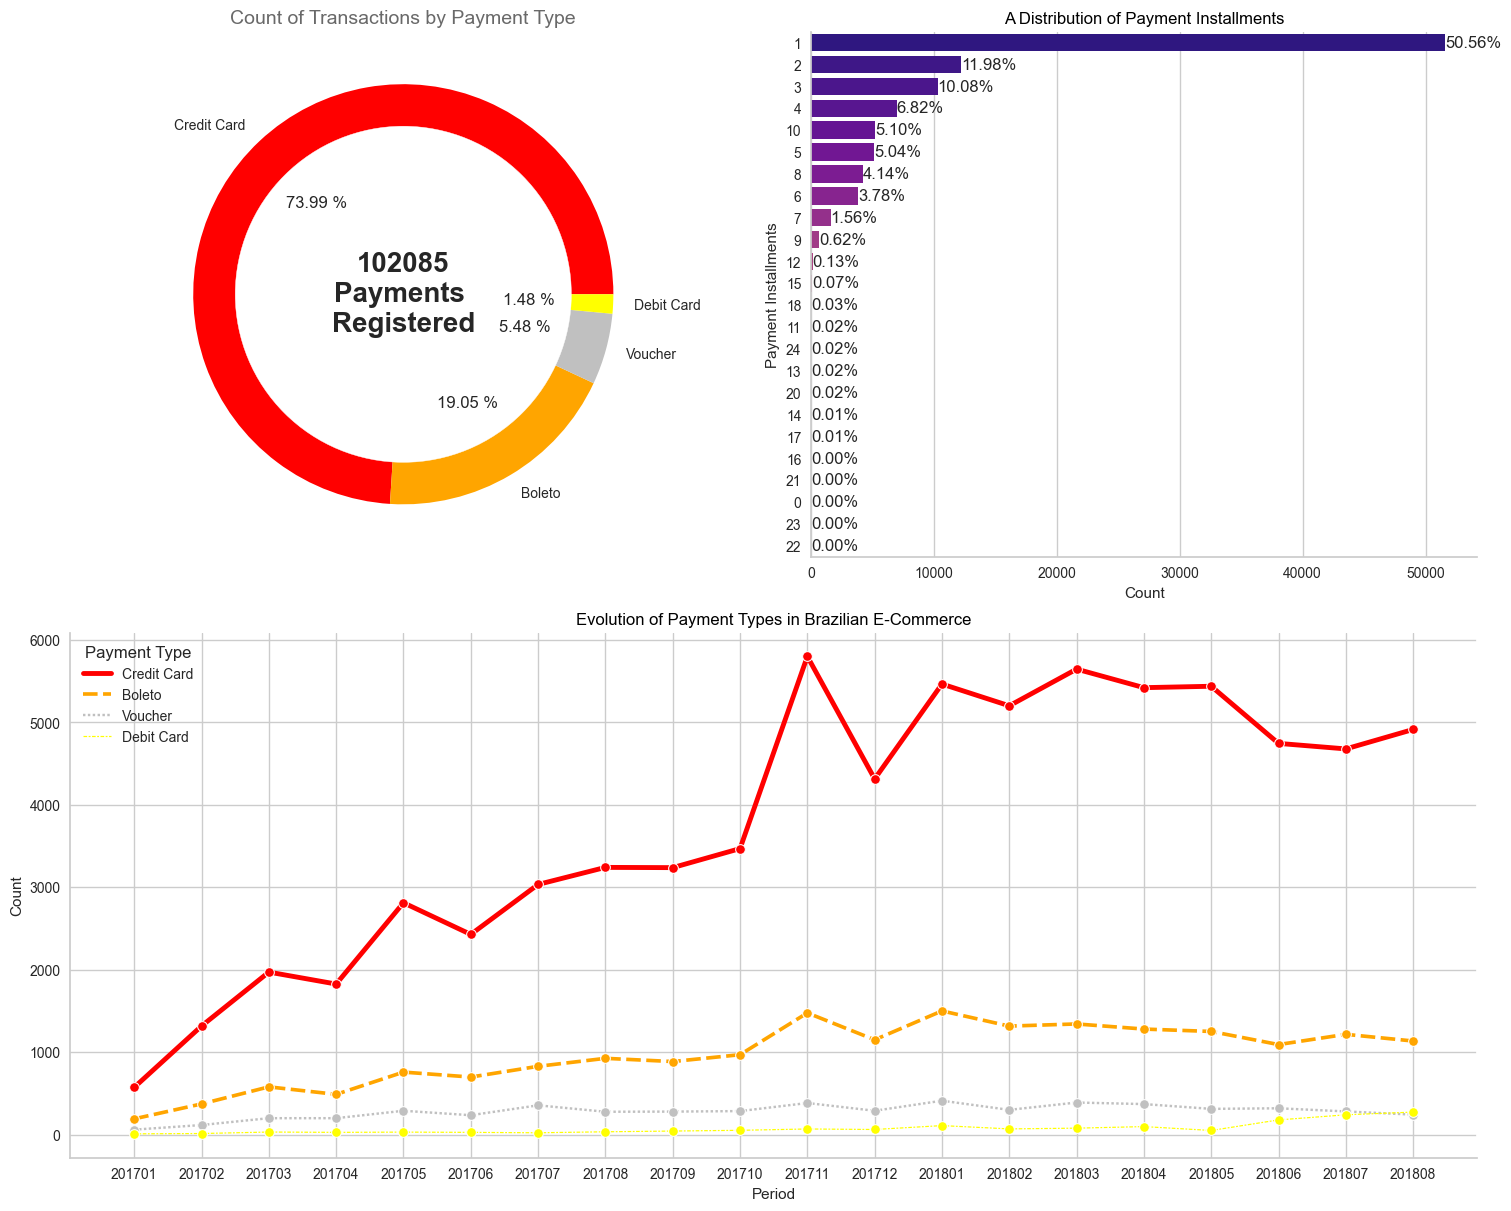
Insight:
Customer Segmentation by Clustering
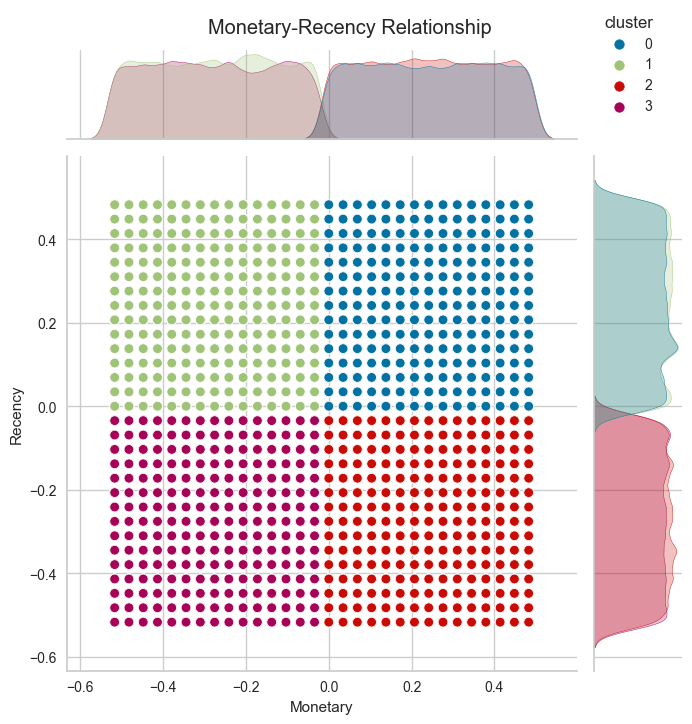
Based on the result of the clustering, we can conclude:
Clusters Classification
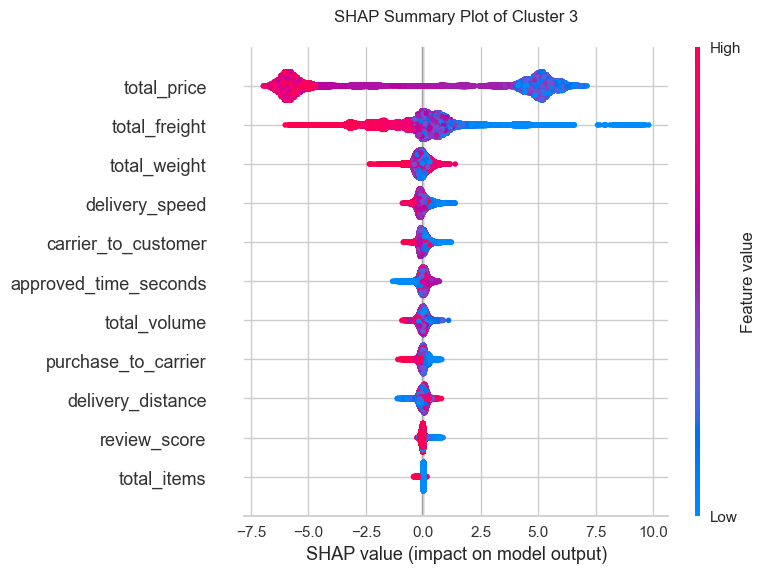
Feature Importances
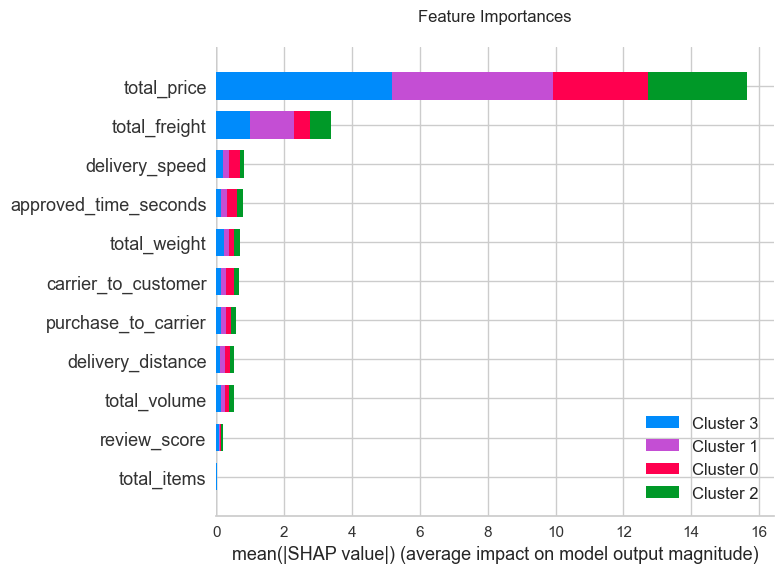
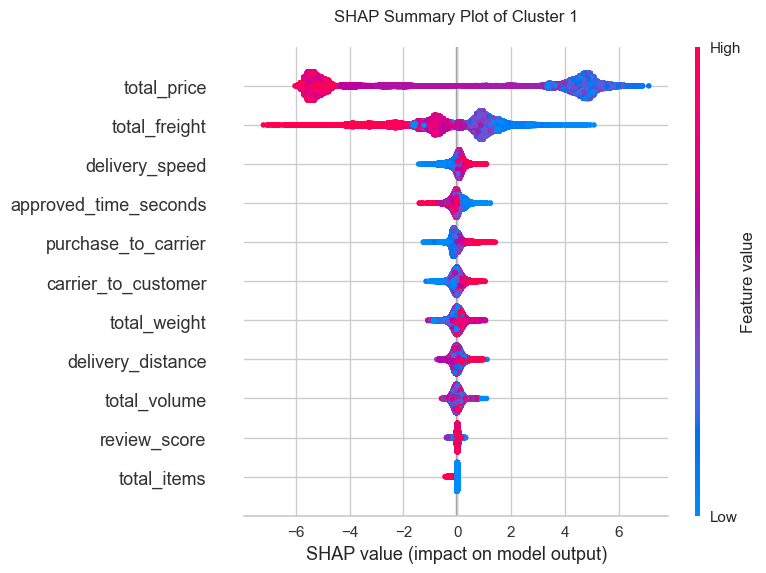
Based on feature importances quantified by Shapley value, the two most important features are total_price and total_freight. Meanwhile, other features seem to have insignificant impacts on model output as shown above. This result does not imply the correlation nor the relationship of the features to the output, merely the significance power of the features to the output itself.
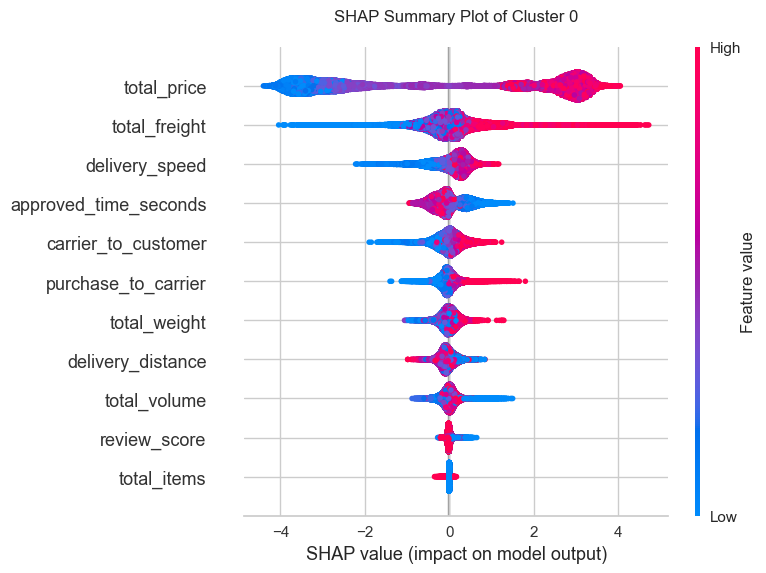
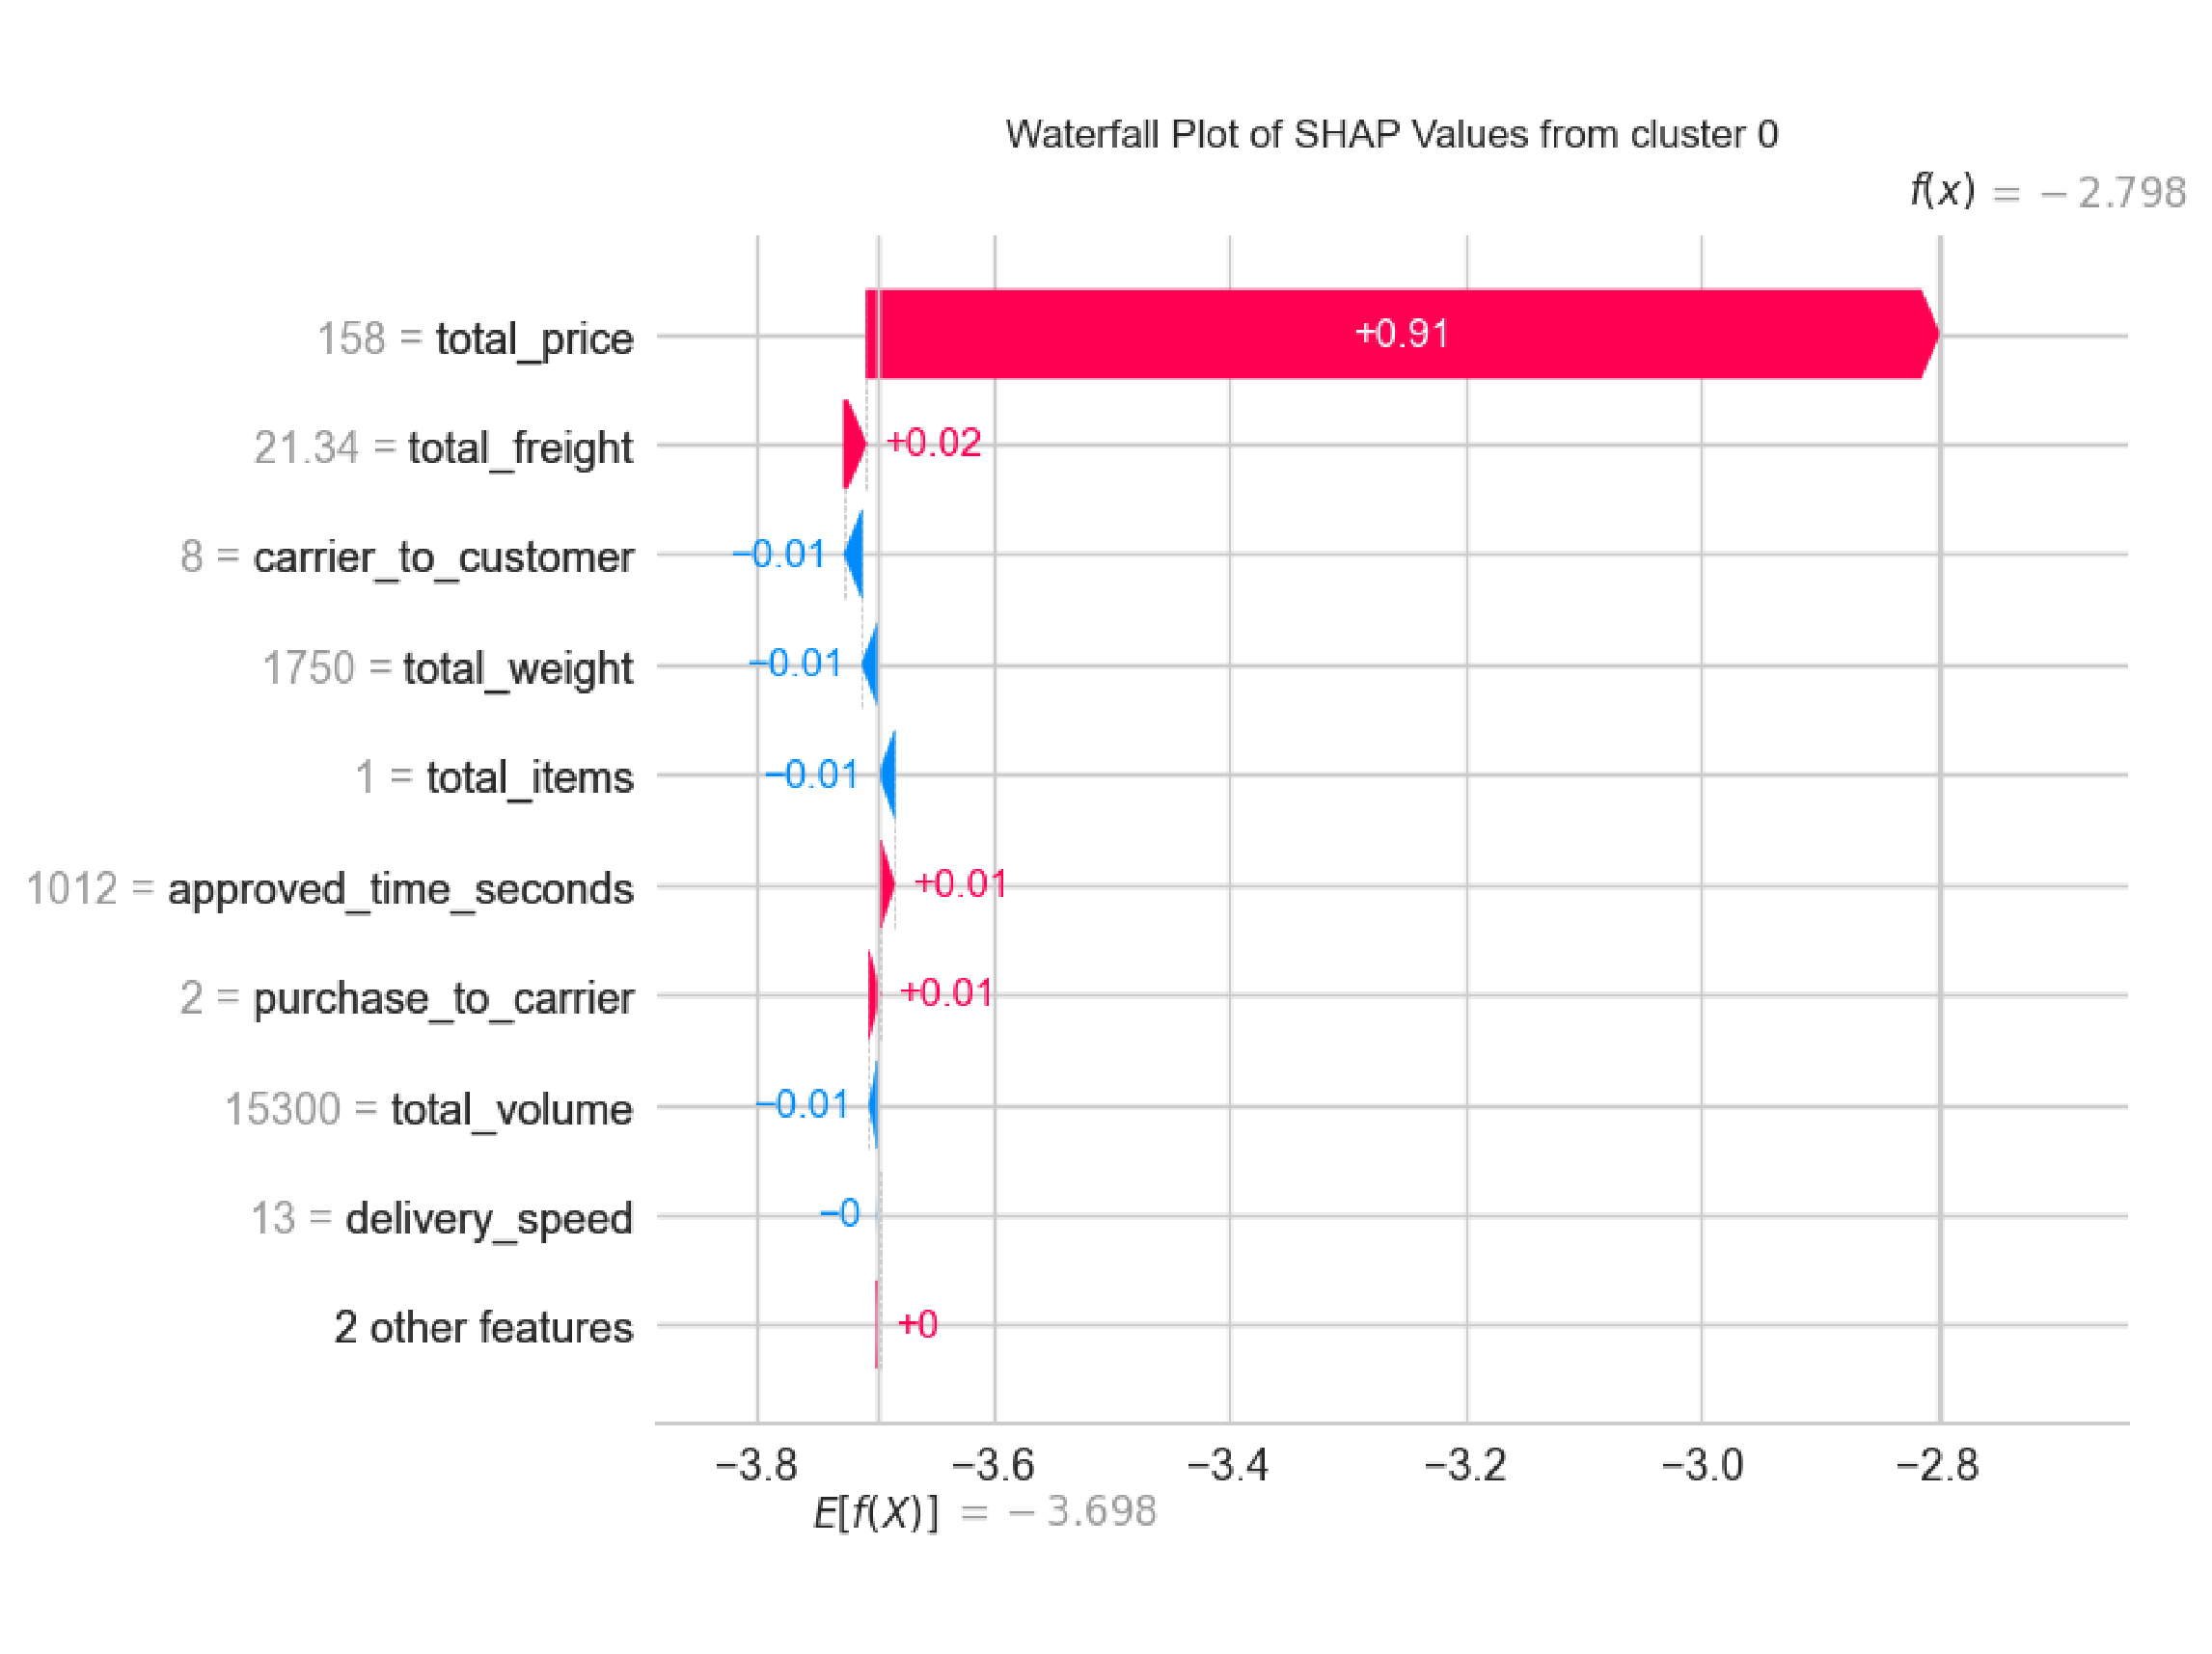
Explainable AI for Cluster 0
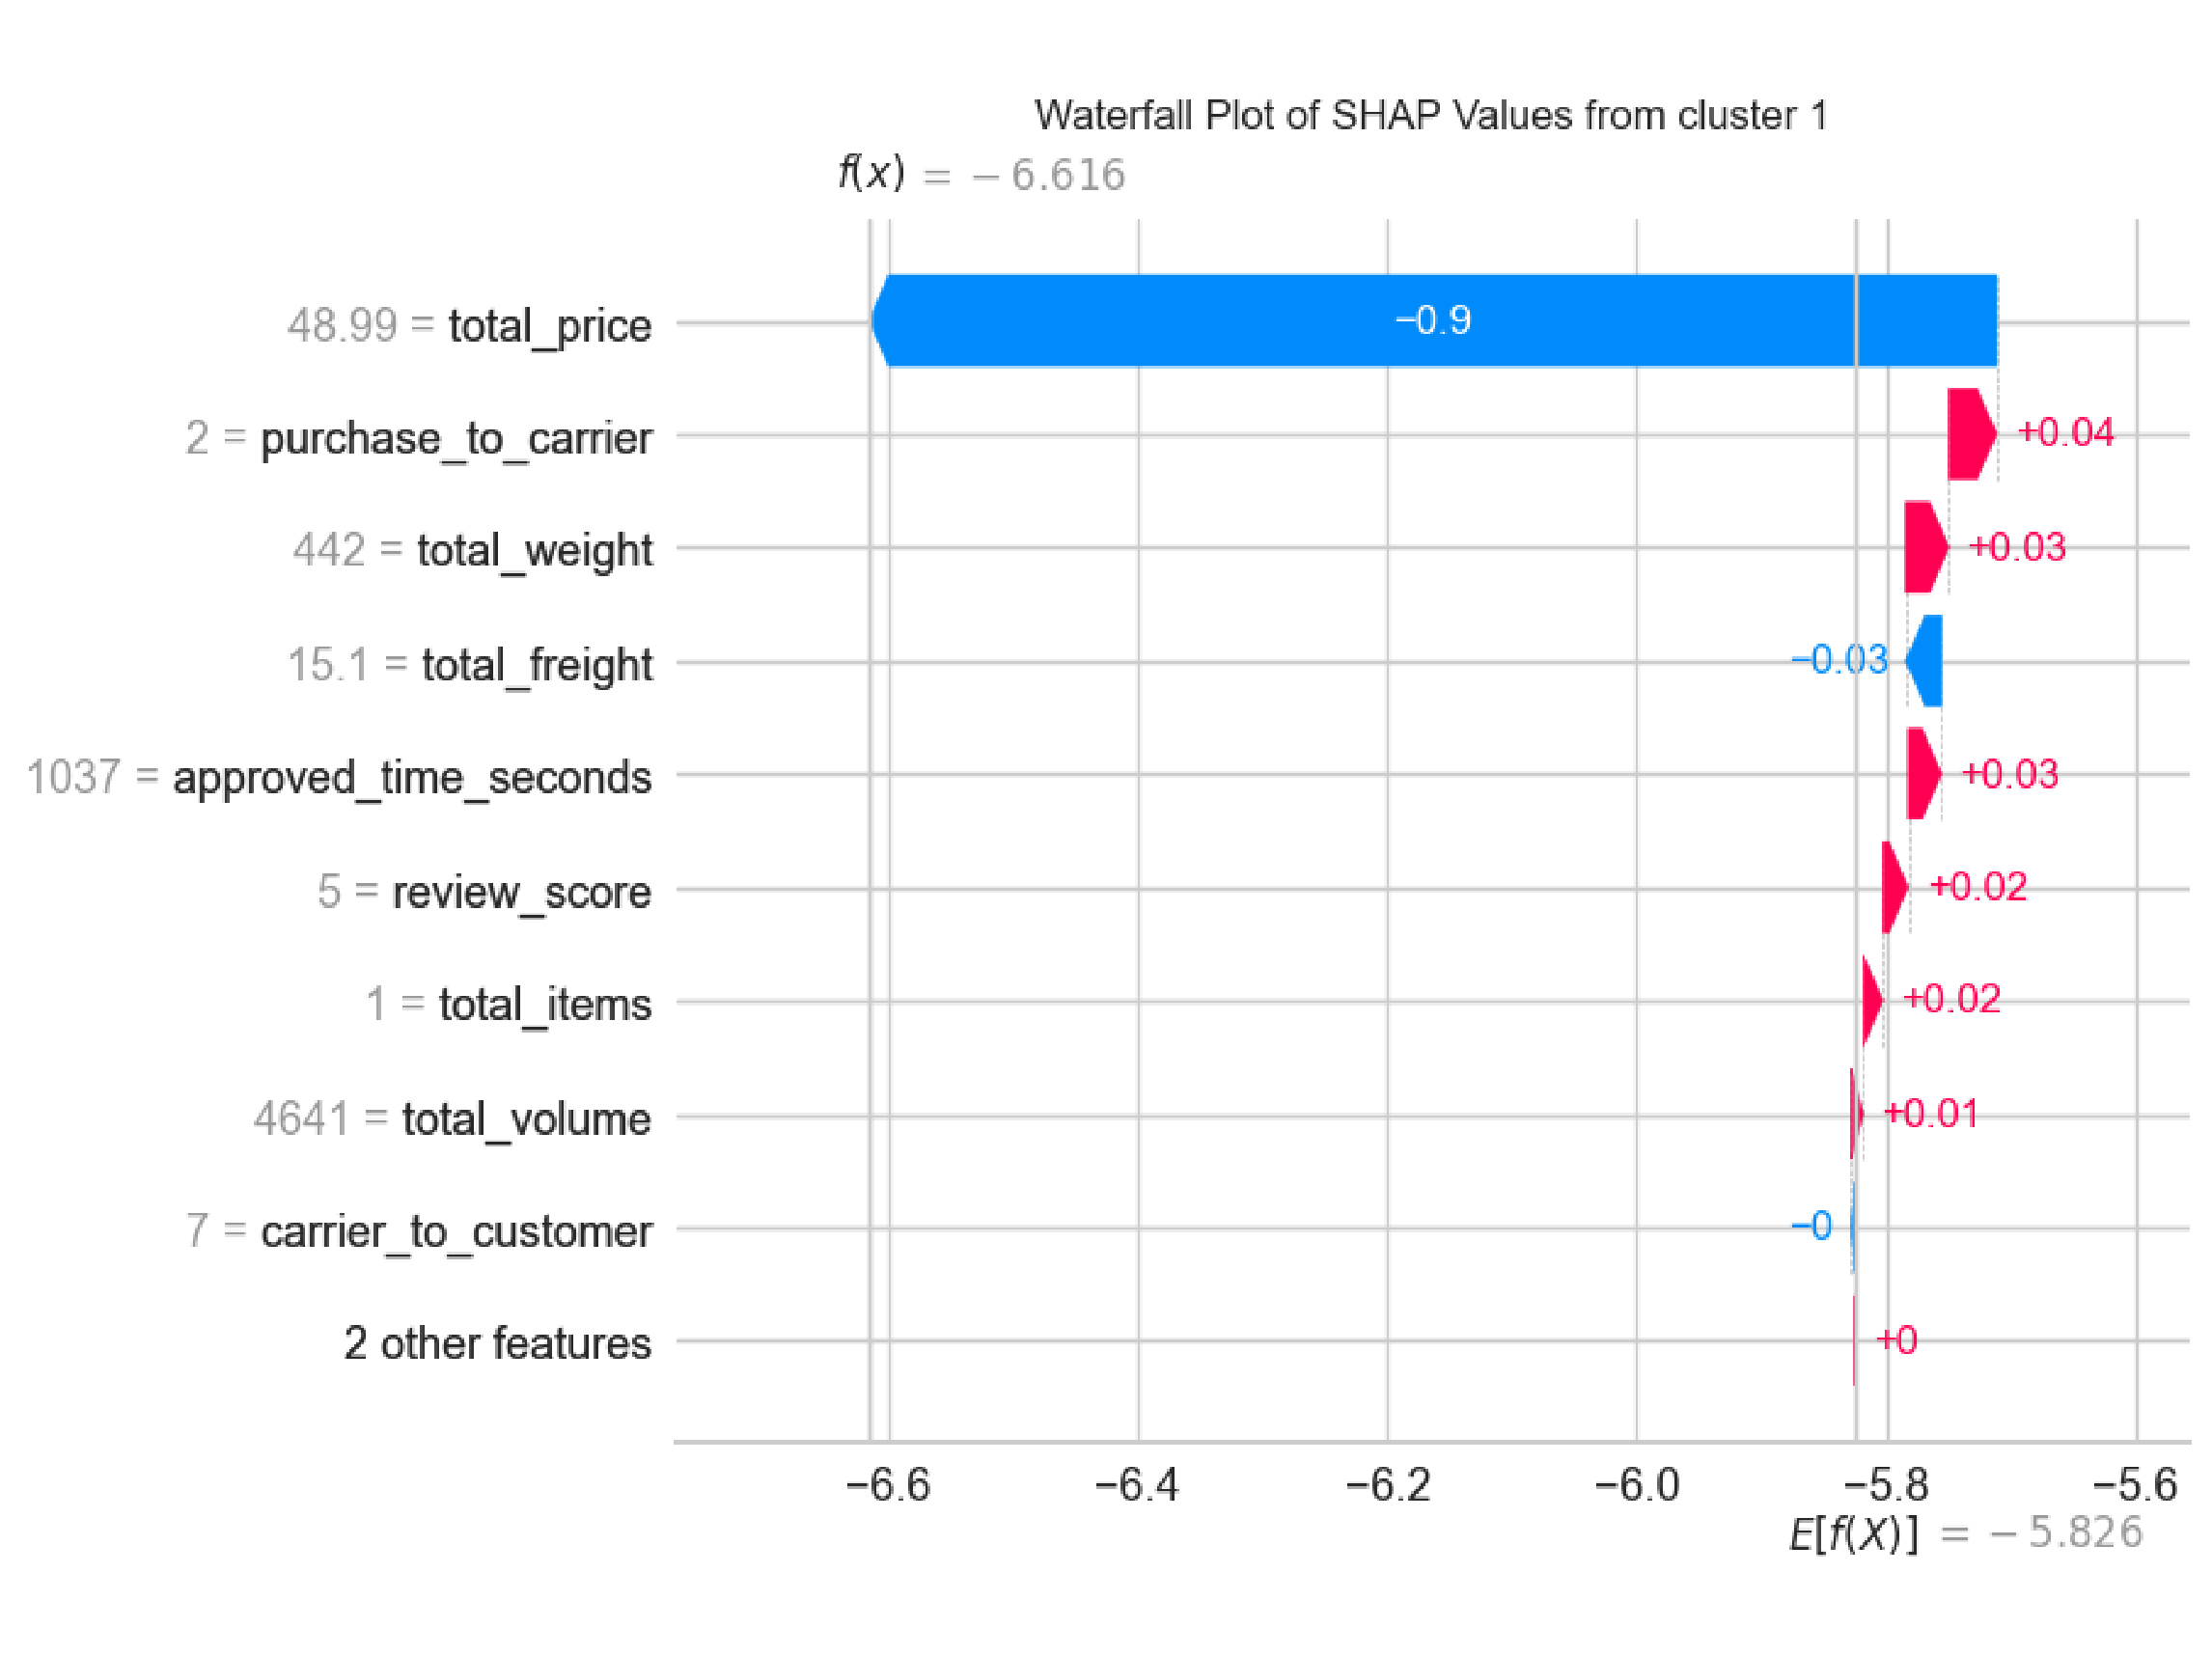
Explainable AI for Cluster 1
aaaa aaaa aaaa aaaa aaaa aaaa aaaa aaaa aaaa aaaa aaaa aaaa aaaa aaaa aaaa
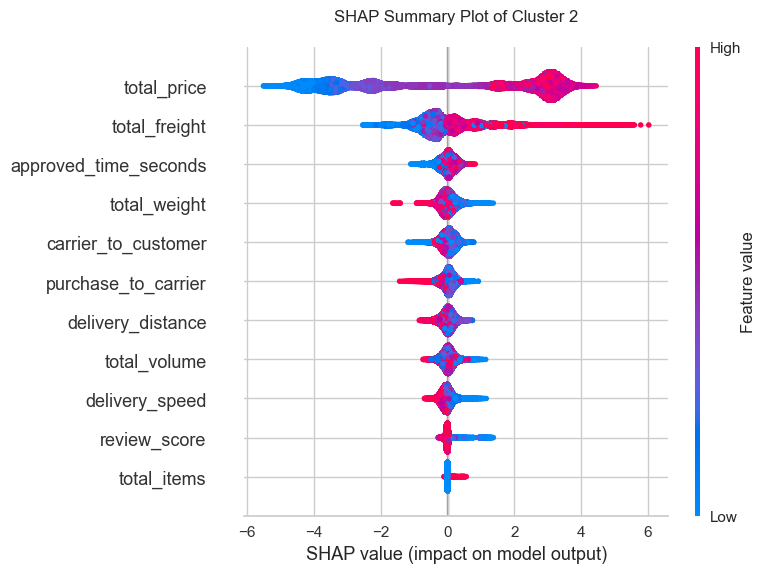
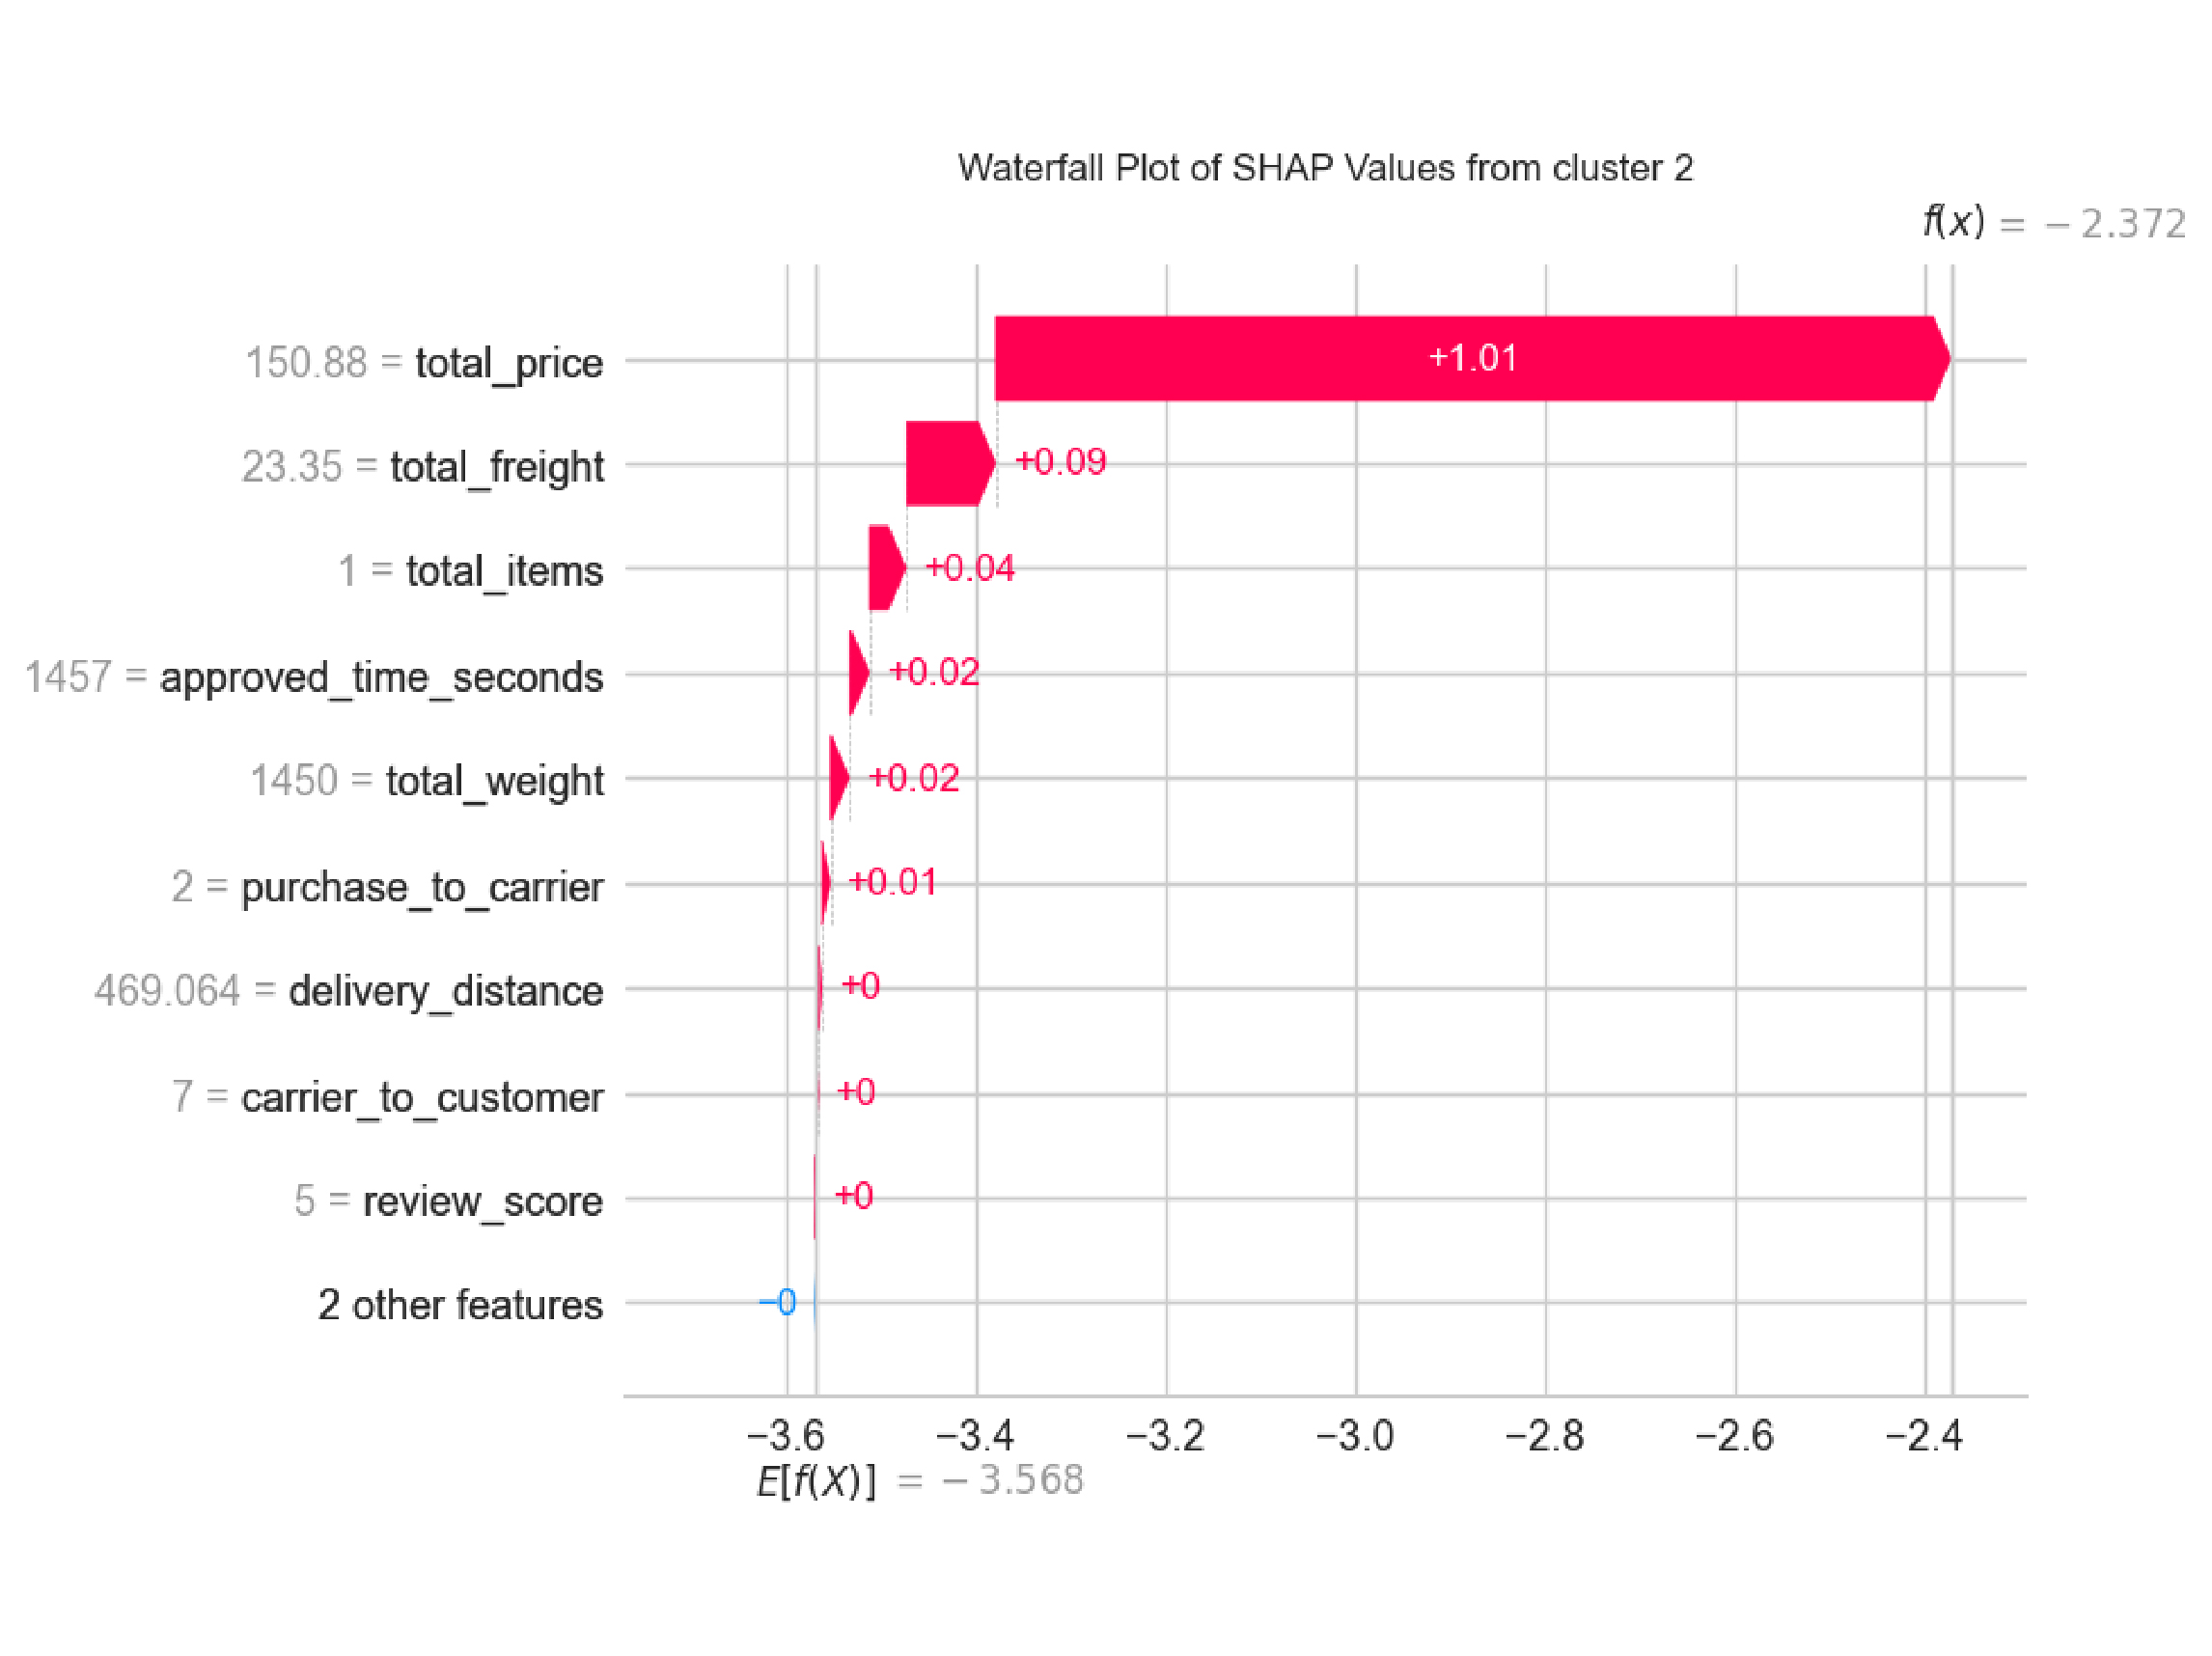
Explainable AI for Cluster 2
aaaa aaaa aaaa aaaa aaaa aaaa aaaa aaaa aaaa aaaa aaaa aaaa aaaa aaaa aaaa
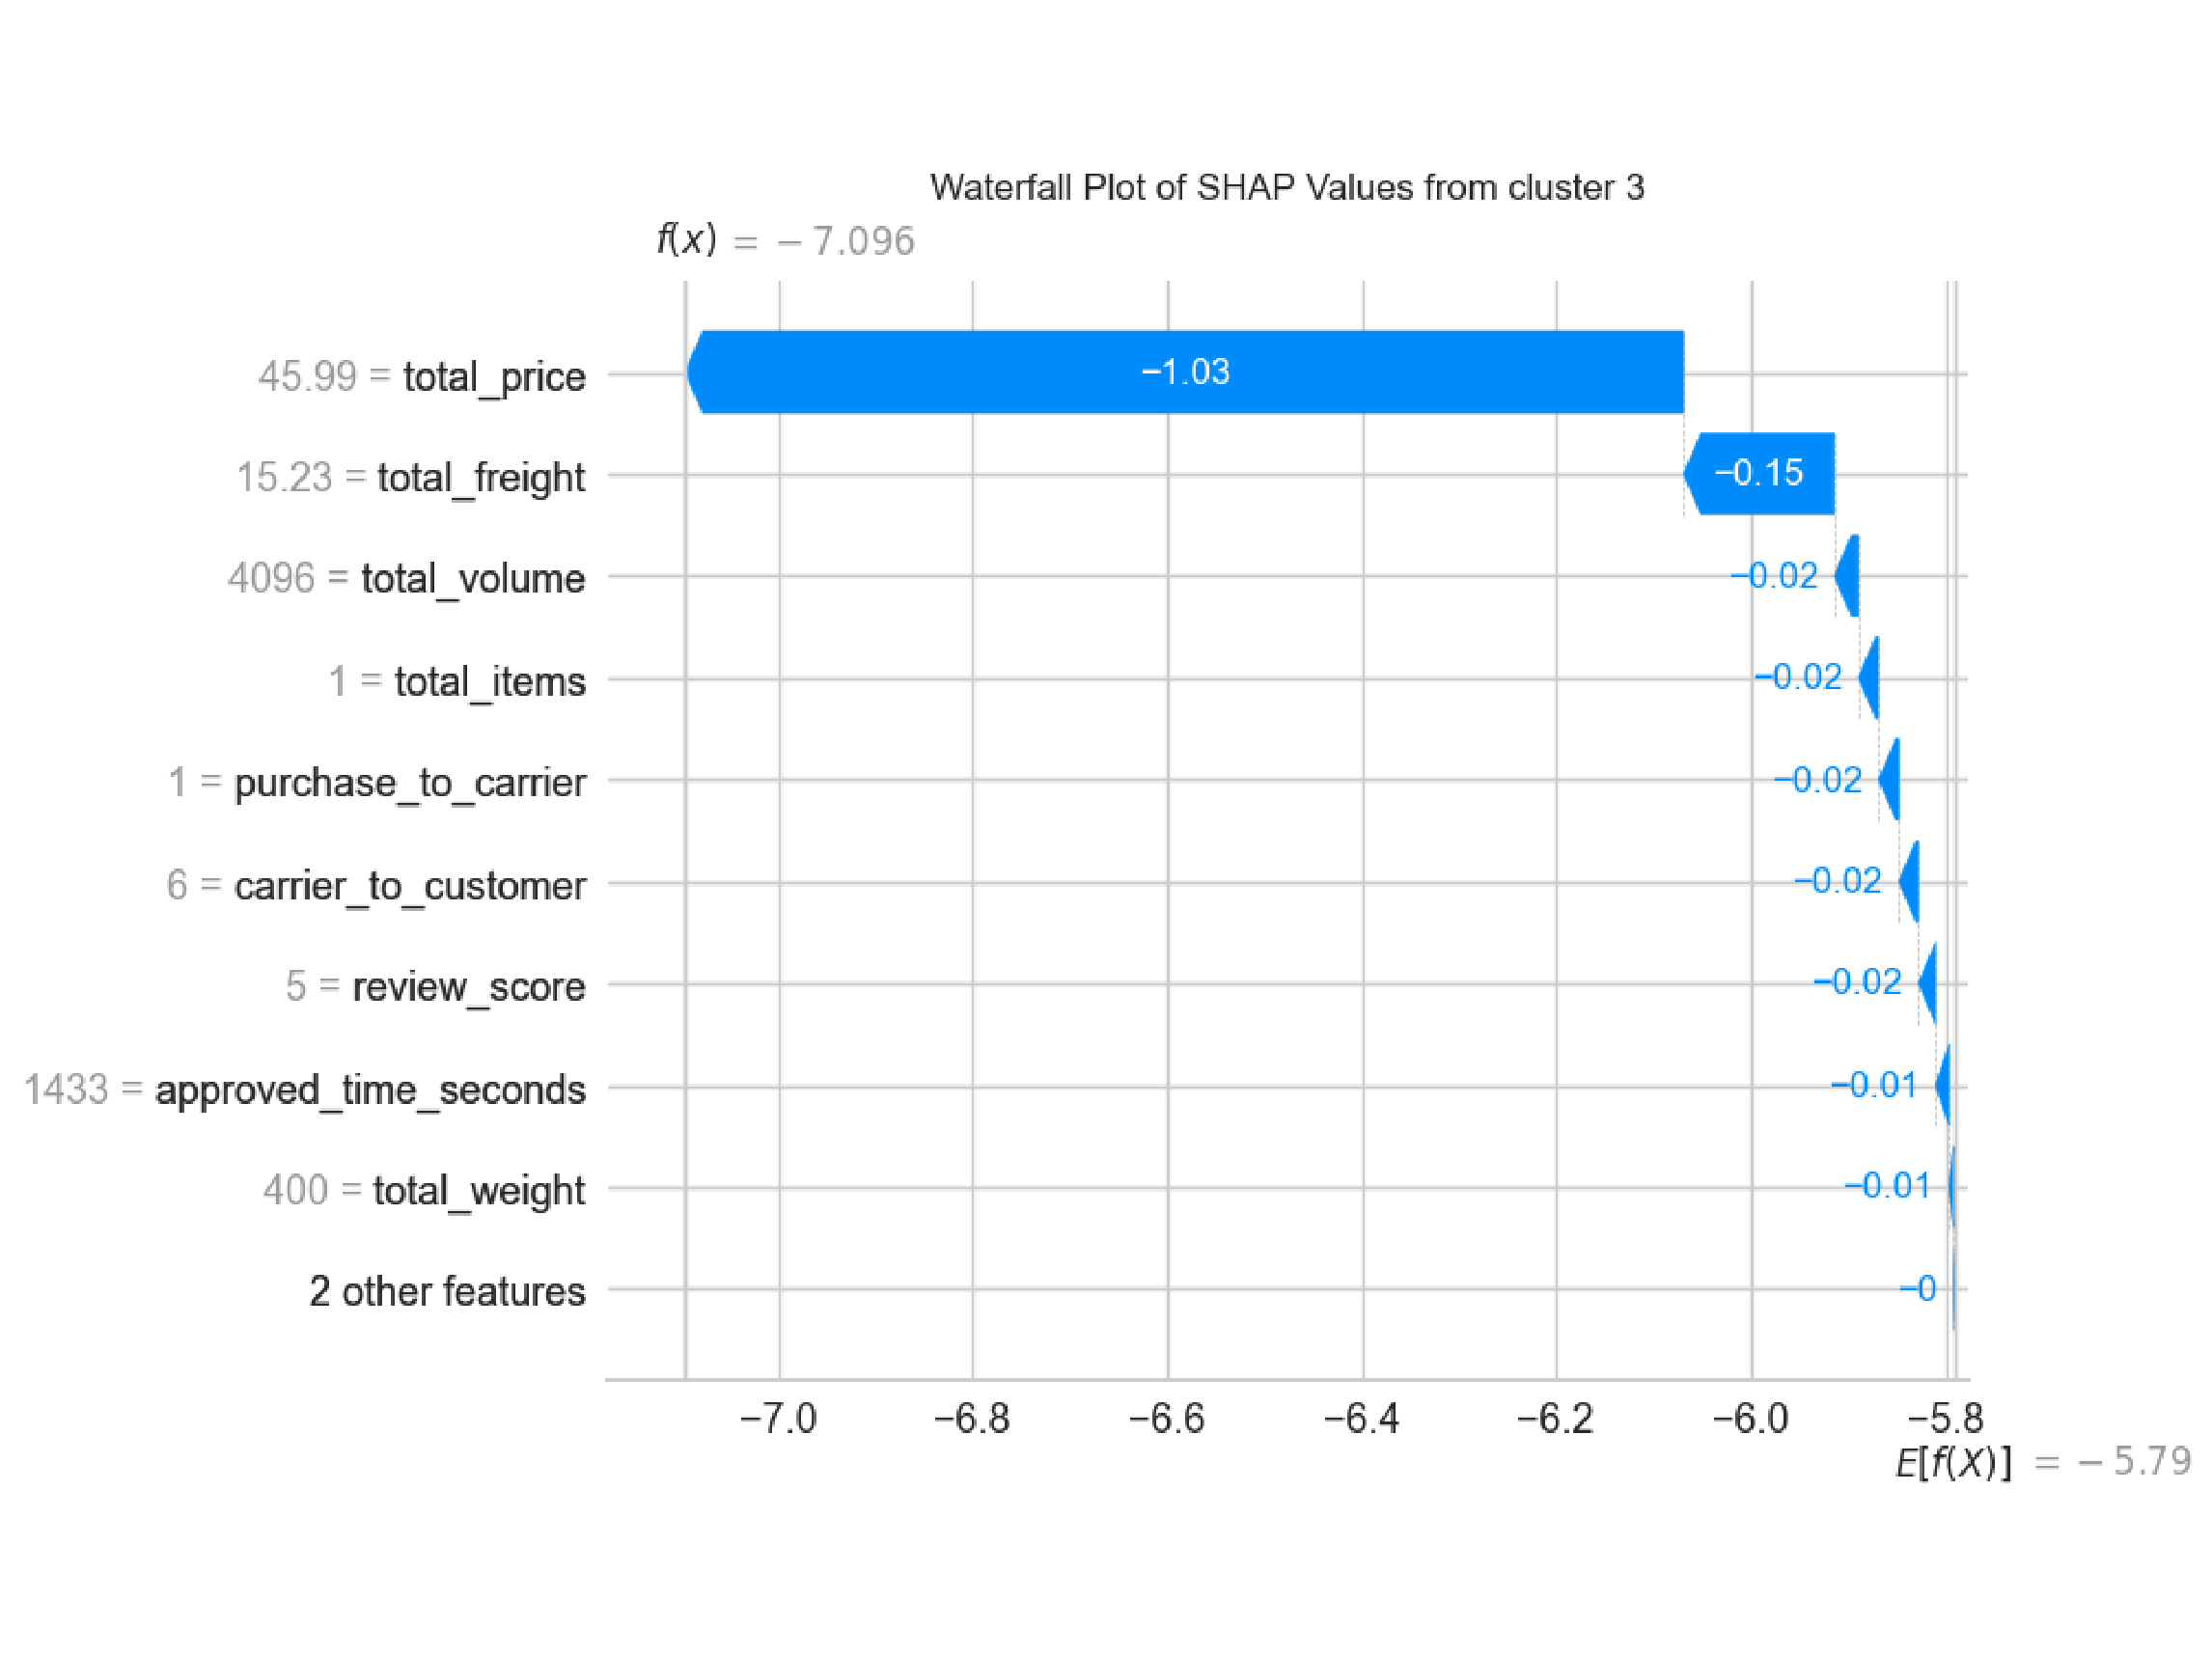
Explainable AI for Cluster 3
aaaa aaaa aaaa aaaa aaaa aaaa aaaa aaaa aaaa aaaa aaaa aaaa aaaa aaaa aaaa
Conclussion & Recommendation
Conclussion
Recommendation
-
Class 0: Old High-Value Customer. Goal: Draw Interest. How:
- Focus on building customer retention by giving discount on high value items.
- Provide excellent customer service and ensure a seamless shopping experience for their high-value transactions.
- On-time delivery guarantee, late delivery will result in a free shipment in the next purchase.
- Create an appealing and user-friendly experience for the customer.
- Give a better shipping services, by live tracking of shipment.
-
Class 1: Potential Churners. Goal: Draw Interest & Increase Spending. How:
- Customer re-enggagement by giving an old user promotion to draw back to use the e-commerce.
- Collect feedback from these customers to understand their concerns or issues and address them promptly.
-
Class 2: Best Customer. Goal: Retain & if possible increase. How:
- Giving promotion on all items include the lower or higher value products.
- Provide points and rewards to incentivize repeat purchases.
-
Class 3: Fresh Shopper. Goal: Increase Spending. How:
- Implement strategies to increase their average order value by offering bundle deals.
- Give a first-timer promotion like free shipping for a whole month.
- Provide a detailed purchasing process which with easy to use shopping cart and multiple payment option.
- Show product recommendation by previous purchase.
intentionally left blank
Please find codes detailed on Github channel.